

fig10
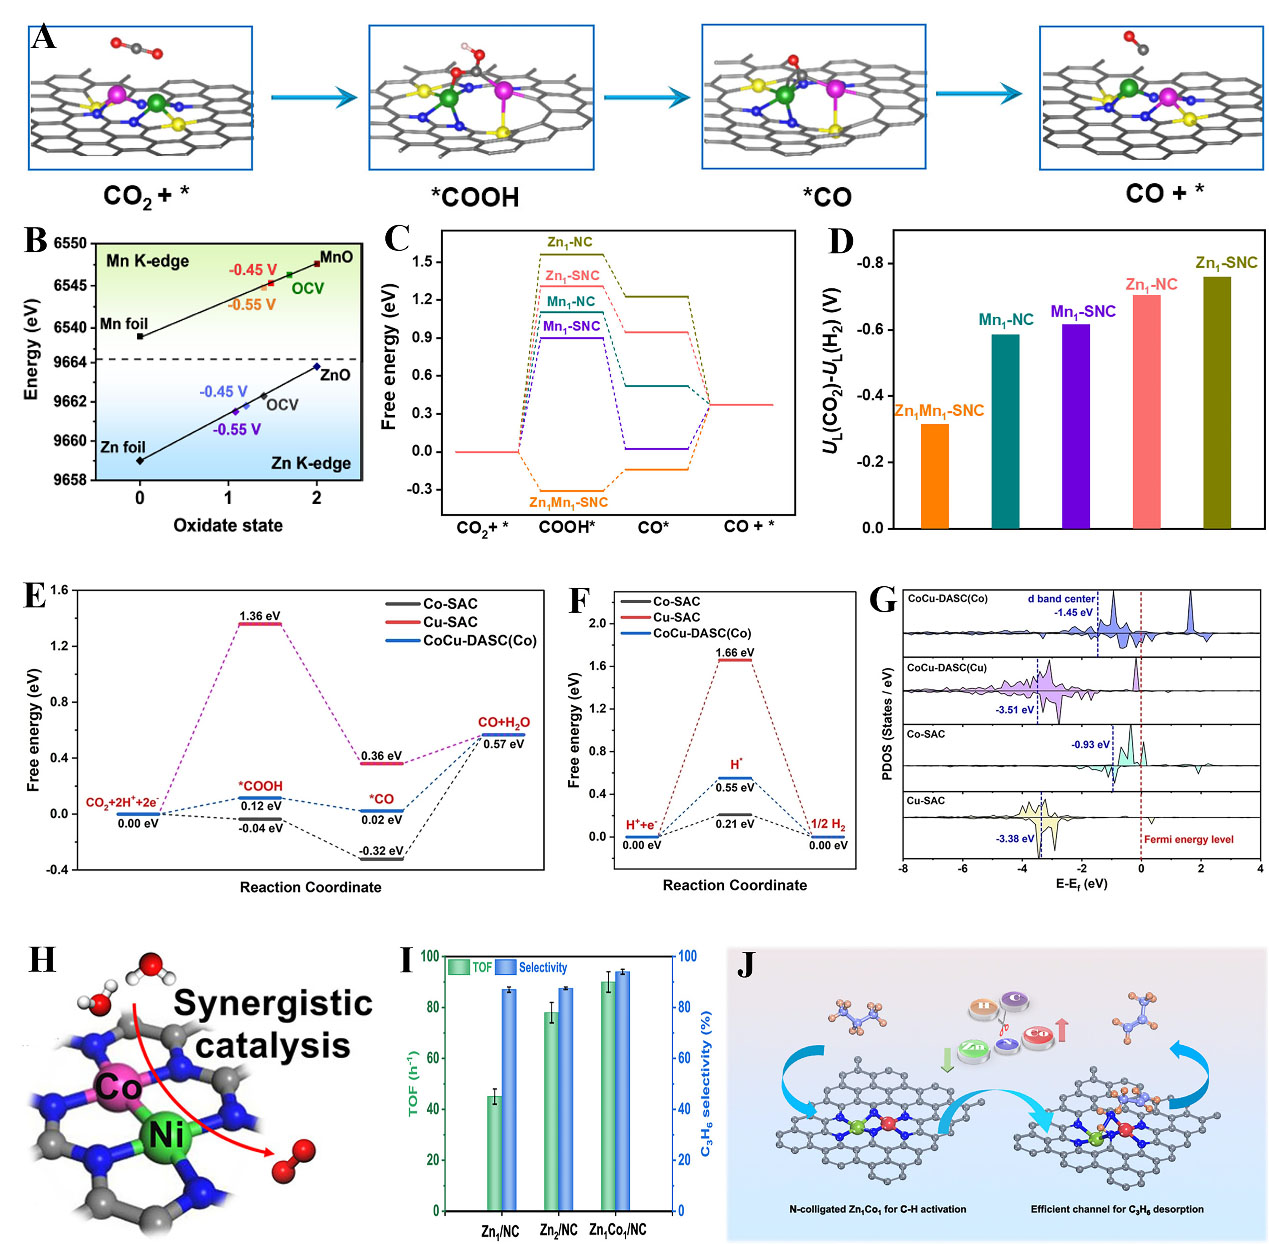
Figure 10. (A) Illustration of CO2 reduction on Zn-Mn DAC; (B) In situ ATR infrared spectra; (C) Free-energy profiles for CO2RR to CO; (D) The differences in limiting potential for CO2RR and HER; (A-D) Reproduced with permission from Ref.[159]. Copyright 2024, Wiley-VCH; (E) Free energy profiles of CO2 reduction; (F) Free energy profiles of HER; (G) The pDOS for the CoCu-DASC, Co-SAC, and Cu-SAC; (E-G) Reproduced with permission from Ref.[160]. Copyright 2022, Wiley-VCH; (H) Schematics of the NiCo synergy for OER. Reproduced with permission from Ref.[163]. Copyright 2022, Wiley-VCH; (I) TOF values and C3H6 selectivity during PDH reaction on Zn1/NC, Zn2/NC, and Zn1Co1/NC; (J) Schematic diagram of the enhanced activation of C3H8 and selectivity of C3H6 for the PDH reaction; (I-J) Reproduced with permission from Ref.[101]. Copyright 2024, American Chemical Society. DACs: Dual-atom catalysts; HER: hydrogen evolution reaction; SACs: single-atom catalysts; ATR: attenuated total reflection; OER: oxygen evolution reaction; TOF: turnover frequency; PDH: propane dehydrogenation.


