

fig11
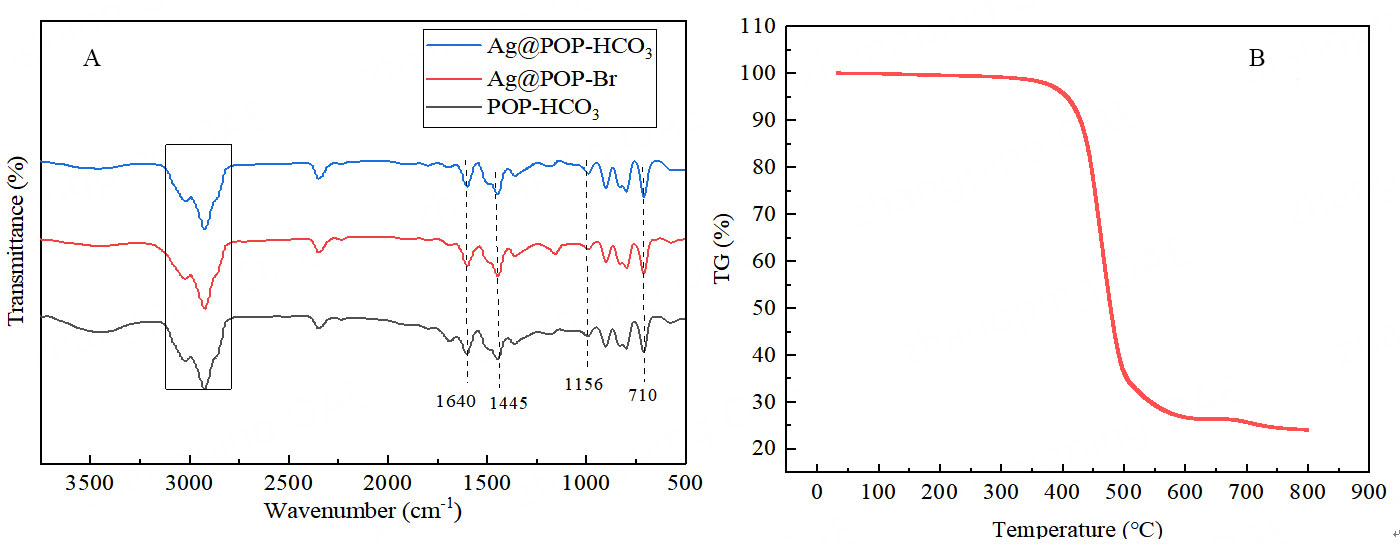
Figure 11. (A) FT-IR spectra of Ag@POP-HCO3, Ag@POP-Br and POP-HCO3; (B) Thermogravimetric analysis diagram of Ag@POP-HCO3.
Figure 11. (A) FT-IR spectra of Ag@POP-HCO3, Ag@POP-Br and POP-HCO3; (B) Thermogravimetric analysis diagram of Ag@POP-HCO3.


All published articles are preserved here permanently:
https://www.portico.org/publishers/oae/


