

Research on arc length threshold of pantograph-catenary interaction leading to excessive disturbances in traction drive systems
 0
0  ,
, Abstract
With increasing train speeds, intensified vibrations in the pantograph-catenary (PC) system make separation between the pantograph and the contact wire - and the resulting arcing - more likely. These arcs degrade the current collection quality of high-speed trains, destabilize the traction drive system, and generate harmonics and electromagnetic interference that affect onboard communication equipment. This study investigates the impact of PC arcing at different train speeds on the traction system’s input voltage and rectifier-side direct-current (DC) voltage, and determines the corresponding acceptable arc length thresholds. An equivalent impedance model of the autotransformer traction network incorporating messenger wires and droppers is developed, together with a Habedank black-box arc model that accounts for the dynamic variations in dissipated power and voltage gradient with changing arc length. In parallel, an alternating current traction drive system model incorporating a pulse rectifier and traction motor is constructed, and its validity is verified by comparing simulation results with experimental data. Results indicate that within the allowable voltage disturbance range (input voltage 1,085-1,922 V; DC-side fluctuation ≤ 5%), the input voltage arc length threshold decreases from 0.887 cm to 0.826 cm as train speed increases from 200 km/h to 300 km/h, while the DC-side threshold drops from 1.28 cm to 0.75 cm. These findings reveal that higher speeds increase the sensitivity of the traction converter to voltage disturbances - identical arc lengths cause stronger voltage fluctuations. Moreover, for a given train speed, the input voltage arc length threshold remains higher than that of the rectifier-side DC voltage.
Keywords
1. INTRODUCTION
1.1. Background description
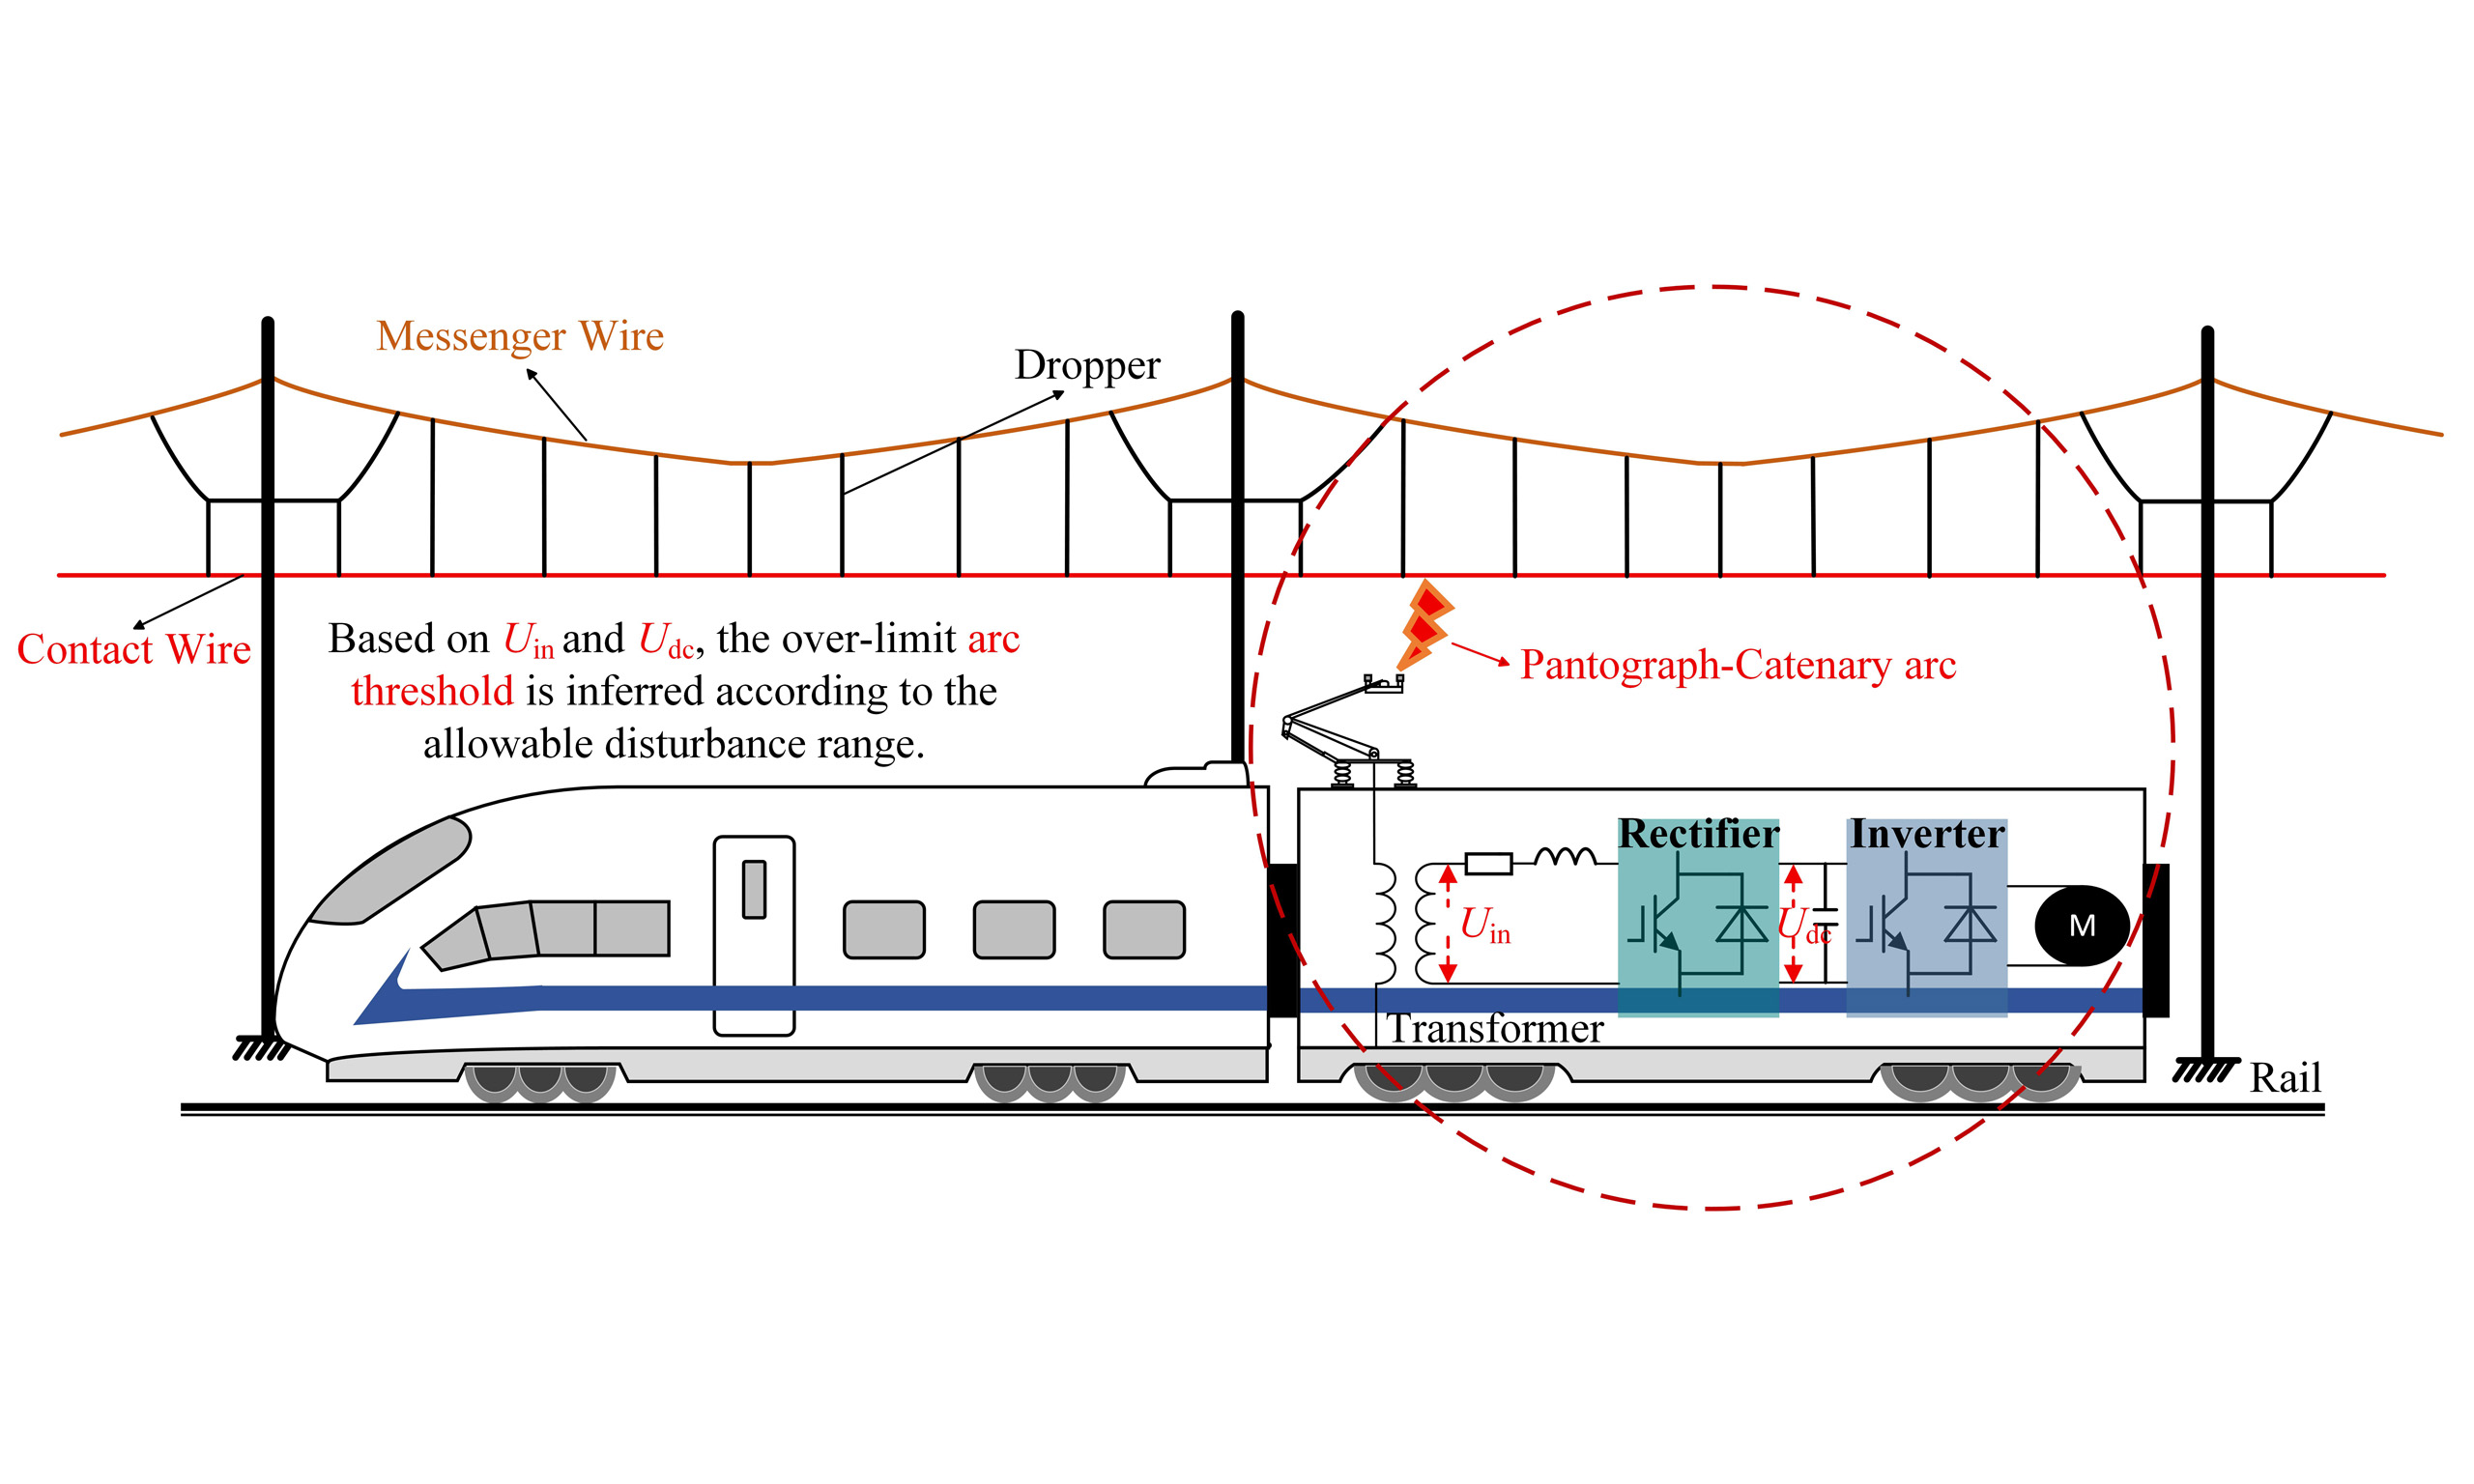
The electrified railway catenary is a suspended system installed along the railway, which supplies electrical energy to trains through sliding contact with the pantograph, serving as the sole source of continuous power for electric locomotives. However, current collection issues remain a major constraint on the stable operation of electrified railways, with pantograph-catenary detachment identified as a critical factor affecting current collection stability. During high-speed train operation, the contact between the pantograph and the catenary is often disturbed by vehicle vibrations, track irregularities[1], and structural hard points[2], resulting in transient separations and electrical arcing[3-5] [Figure 1]. Stability of current collection remains one of the major constraints on the maximum operating speed and reliability of electrified railways, with pantograph-catenary (PC) off-line events recognized as a dominant source of power instability[6,7]. Arcing during these events causes voltage drops at the rectifier side of the traction converter, leading to torque fluctuations in the traction motor[8]. In addition, the resulting arcs accelerate wear of the collector strip[9] and generate harmonic and electromagnetic interference that disrupts traction communication systems[10-12]. Understanding and mitigating PC arcing is therefore essential for improving current collection performance and ensuring the safe, stable operation of high-speed trains.
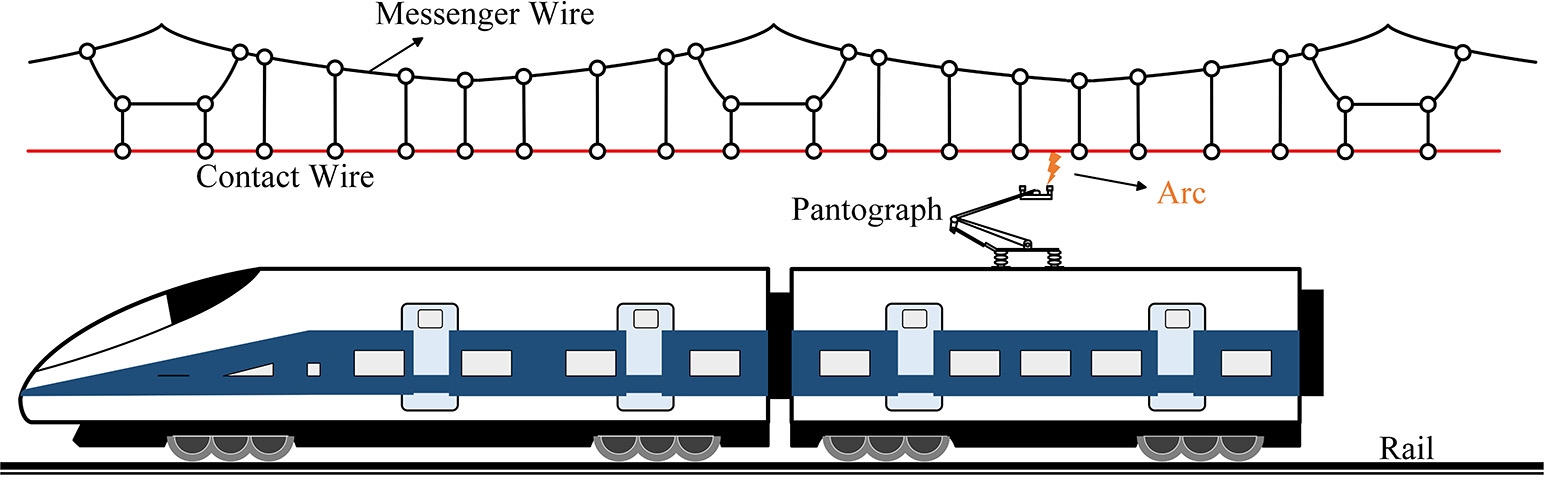
Figure 1. Schematic diagram of arc generated by pantograph-catenary off-line.
1.2. Literature review
Extensive studies worldwide have focused on traction network modeling, PC arc phenomena, and arc detection based on their characteristic features. For traction network modeling, Chen et al.[13] proposed a Thévenin-Thévenin equivalent circuit model that incorporates distributed parameters while simplifying the traction network into a two-port circuit with controlled sources. Brenna et al. and Dolara et al.[14,15] developed a general electromagnetic model for 2 × 25 kV systems, in which geometric and electrical parameters can vary with time and line conditions. Huang et al.[16] established a traction network link model that includes the impedance-frequency characteristics of an integrated grounding system within tunnel sections. Traditional arc detection techniques primarily rely on analyzing the current derivative and its high-frequency components to identify key features such as peaks, shoulders, and rise rates[17-19]. In recent years, image-recognition-based methods have advanced rapidly with the development of artificial intelligence and pattern recognition technologies[20,21]. The optical radiation emitted by PC arcs can be captured using dedicated imaging equipment and analyzed through spectral decomposition, morphological analysis, and color feature extraction to achieve a multi-dimensional representation of arc characteristics. Although deep neural networks offer high accuracy and recall in real-time arc image recognition, their performance remains strongly dependent on ambient illumination and visibility, limiting effectiveness under occluded or low-light conditions. Gao et al.[22] employed a self-developed fourth-order Hilbert curve fractal antenna to detect arcs based on their electromagnetic radiation signals. Yan et al.[23] proposed a low-voltage direct-current (DC) arc detection approach using characteristic frequency analysis, applying a 90-110 kHz band-pass filter for feature extraction and an improved convolutional neural network (CNN) to achieve over 99.88% classification accuracy with real-time performance. Li et al.[24] used a dedicated arc generator to observe current zero-crossing cycles, extracting five temporal parameters for quantitative characterization and employing an optimized support vector machine (SVM) classifier to achieve detection accuracy exceeding 96%. Du et al.[25] enhanced arc detection robustness and accuracy through the fusion of current and electromagnetic signals combined with ensemble empirical mode decomposition (EEMD)-based feature extraction. In addition, several railway companies, such as the French National Railway Company (SNCF), have explored diagnosing arcs through their disturbances on electrical equipment[26,27], though the corresponding arc threshold issue has not been addressed.
1.3. Contribution of this work
The aforementioned traction network models typically simplify the messenger wire, droppers, and contact wire into a single equivalent conductor, making it impossible to accurately measure current distribution parameters or detect electrical connection signals. Consequently, these models exhibit certain discrepancies compared with real operating conditions. Existing studies on arc detection exhibit inherent limitations. Image recognition approaches are highly dependent on environmental conditions, while feature extraction methods are often affected by spectral overlap from operational interference sources - particularly harmonic distortions introduced by onboard alternating current (AC)-DC conversion modules - compromising the accuracy of arc feature identification. In summary, this study establishes an indirect detection framework based on the disturbance tolerance of electrical parameters in the traction drive system. By analyzing the impact of pantograph-catenary arcing on system voltage and current fluctuations, the occurrence of arcs is inferred, and the maximum tolerable arc length within allowable disturbance limits is determined. This study constructs an extended AT traction network model that accounts for components such as the messenger wire, introduces a parameter-extended Habedank black-box arc model, and develops a complete traction drive system simulation model incorporating a pulse rectifier circuit and traction motor. The main contributions of this work are as follows:
(1) An equivalent AT traction network impedance model incorporating components such as the messenger wire and droppers was established.
(2) A coupled arc-locomotive model is developed that accounts for the influence of locomotive power on arc dynamics, offering higher physical realism
(3) Based on the permissible fluctuation ranges of input and rectifier-side DC voltages, the study defines a critical arc length threshold beyond which the traction drive system experiences unacceptable disturbances.
2. ELECTRIC MODEL OF TRAIN NETWORK WITH ARCING
As shown in Figure 2, the proposed model primarily consists of an extended AT traction network model, an arc module, and the train traction drive system. From the perspective of the dynamic PC interaction, the arc length is introduced as an extended parameter to establish a dynamic off-line arc model. Based on a transient current control strategy and space vector pulse-width modulation (SVPWM), the constructed traction drive system incorporates the actual electrical parameters of the high-speed train.
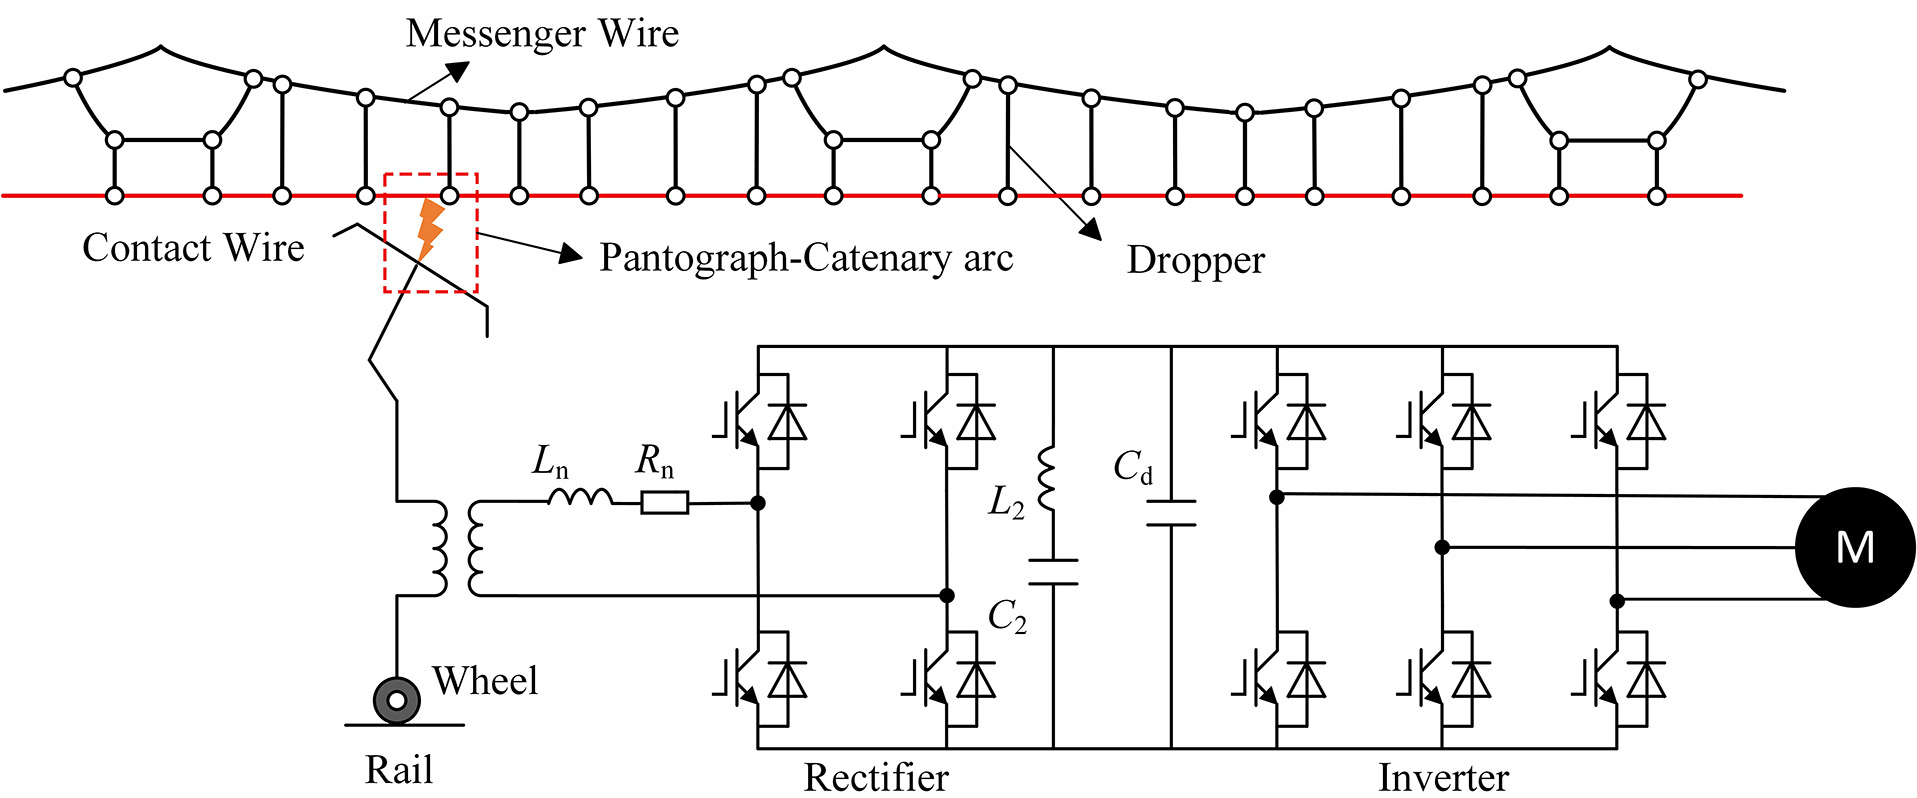
Figure 2. Electrical model of the arc and traction drive system.
2.1. Construction of the extended AT traction network model
In high-speed railway traction networks, the parallel transmission conductors conform to a multiconductor transmission line (MTL) model. However, the presence of autotransformers (ATs), electric locomotives, and cross-connection lines introduces current branches at regular intervals, dividing the network into multiple uniform subsections. This structure - comprising MTL segments as the backbone irregularly segmented by parallel branches - forms a chain-type circuit topology. The model consists of longitudinal series components and transverse shunt components: the longitudinal part represents the parallel MTL segments of the traction network, while the transverse branches mainly include traction substations, ATs, locomotives, and cross-connection lines, as illustrated in Figure 3.
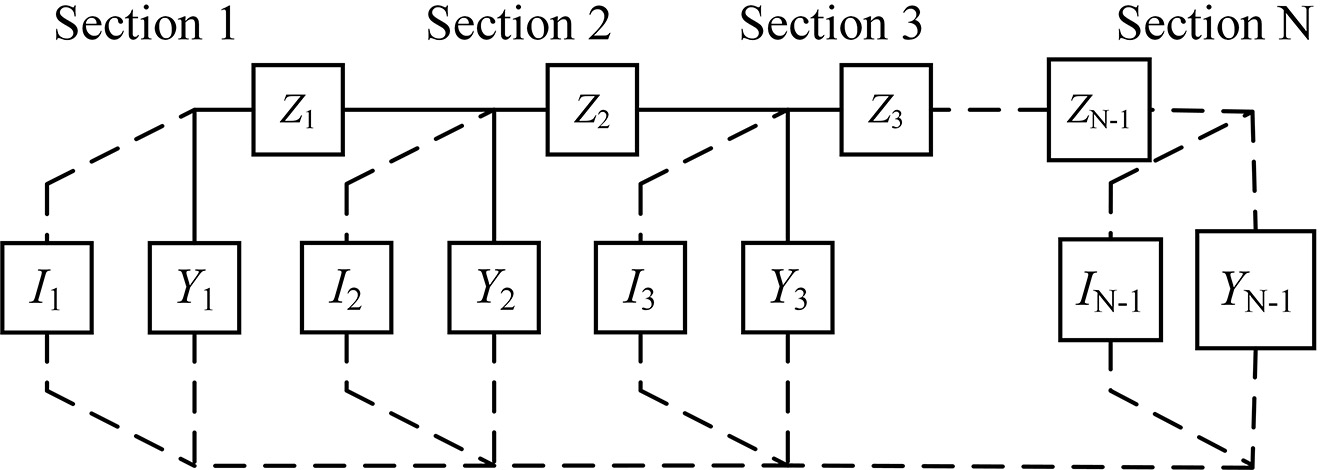
Figure 3. Chain circuit.
The electrical parameters of the traction network - including series impedance and shunt admittance - form the foundation of electrified railway system modeling, as they are directly linked to the mathematical representation of the network. Accurate parameterization is essential for validating voltage levels, calculating voltage drops, and designing and setting relay protection strategies. Based on the conductor configuration shown in Figure 4 and the primary conductor properties listed in Table 1, the electrical parameters of each conductor - specifically the impedance and admittance matrices - are computed. For computational simplicity, the catenary structure is appropriately simplified: since droppers and electrical connectors are arranged perpendicularly between the contact and messenger wires, their mutual inductance with other conductors is neglected. Additionally, due to their short lengths relative to the contact wire, mutual inductance among these short conductors is also omitted. The calculation results are shown in Table 2.
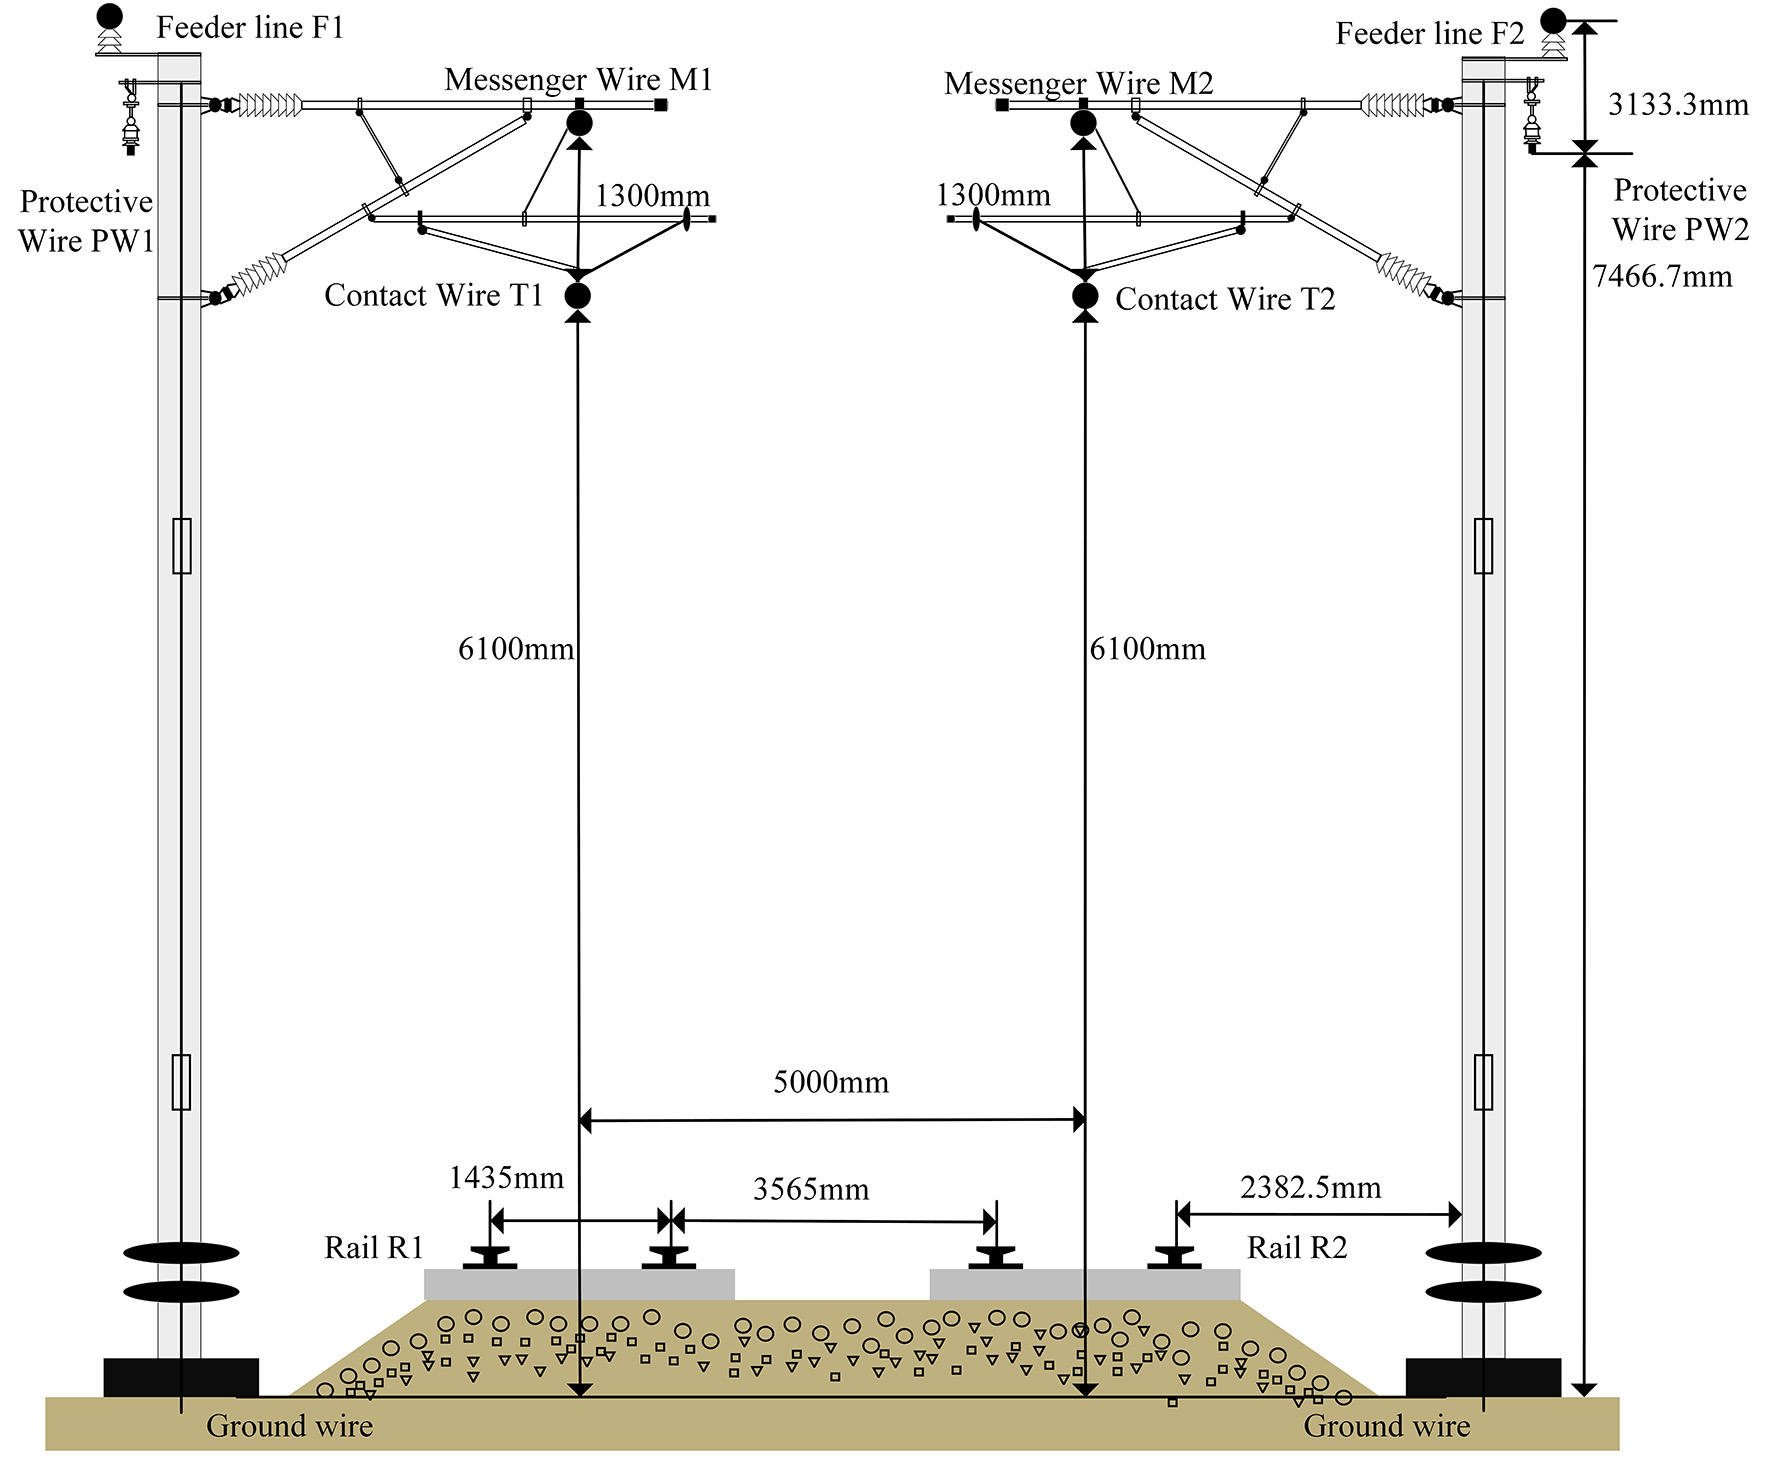
Figure 4. Spatial distribution of conductors in the traction network.
Parameters of conductors in the traction network
| Conductor name | Conductor type |
| Messenger wire | JTMH120 |
| Contact wire | CTMH150 |
| Protective wire | LBJLJ-120/20 |
| Feeder wire | LBGLJ-240/30 |
| Rail | UIC60 |
| Dropper | JTMH10 |
Traction network impedance
| M1 | T1 | R1 | F1 | PW1 | |
| M1 | 0.291 + j0.741 | 0.049 + j0.408 | 0.0487 + j0.345 | 0.0485 + j0.31 | 0.049 + j0.358 |
| T1 | 0.049 + j0.408 | 0.233 + j0.739 | 0.0485 + j0.108 | 0.496 + j0.01 | 0.049 + j0.113 |
| R1 | 0.0487 + j0.345 | 0.0485 + j0.108 | 0.1939 + j0.232 | 0.049 + j0.095 | 0.0487 + j0.129 |
| F1 | 0.0485 + j0.313 | 0.496 + j0.0098 | 0.049 + j0.095 | 0.117 + j0.178 | 0.0491 + j0.1 |
| PW1 | 0.049 + j0.358 | 0.049 + j0.113 | 0.0487 + j0.129 | 0.0491 + j0.1 | 0.287 + j0.236 |
| M2 | 0.051 + j0.328 | 0.047 + j0.326 | 0.0487 + j0.3 | 0.05 + j0.298 | 0.0503 + j0.298 |
| T2 | 0.047 + j0.326 | 0.486 + j0.108 | 0.0486 + j0.094 | 0.049 + j0.095 | 0.048 + j0.097 |
| R2 | 0.0487 + j0.3 | 0.486 + j0.0943 | 0.0485 + j0.086 | 0.049 + j0.089 | 0.0486 + j0.088 |
| F2 | 0.05 + j0.298 | 0.494 + j0.0927 | 0.0488 + j0.089 | 0.049 + j0.11 | 0.0489 + j0.092 |
| PW2 | 0.0503 + j0.298 | 0.487 + j0.0967 | 0.0486 + j0.088 | 0.049 + j0.092 | 0.0487 + j0.09 |
2.1.1. Impedance calculation
The AT traction network primarily comprises the T, F, R, and PW conductors, with the overhead conductors including T, F, and PW. The equivalent self-impedance to ground for a single overhead conductor, as well as the mutual impedance between any two conductors, can be calculated using Carson’s theory. Under the assumption of Kirchhoff’s laws and equal voltage drops along the lines, a theoretical ground return conductor is introduced deep beneath the earth. Each overhead conductor forms a closed loop with this fictitious return path, establishing an overhead line model with the earth serving as the return medium. Figures 5 and 6 illustrate the equivalent modeling of single- and two-conductor configurations, respectively.
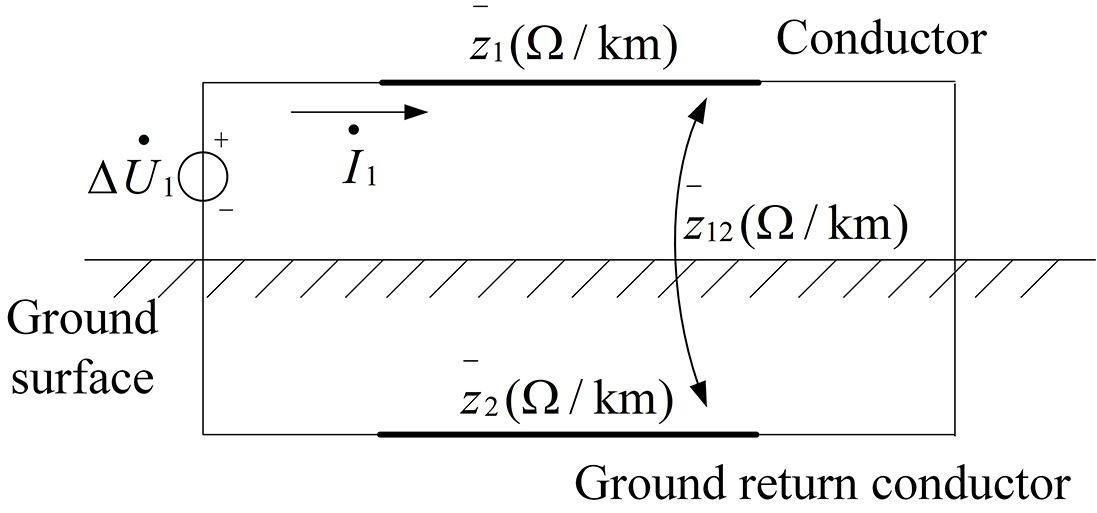
Figure 5. Equivalent model of a single-conductor-to-ground loop.
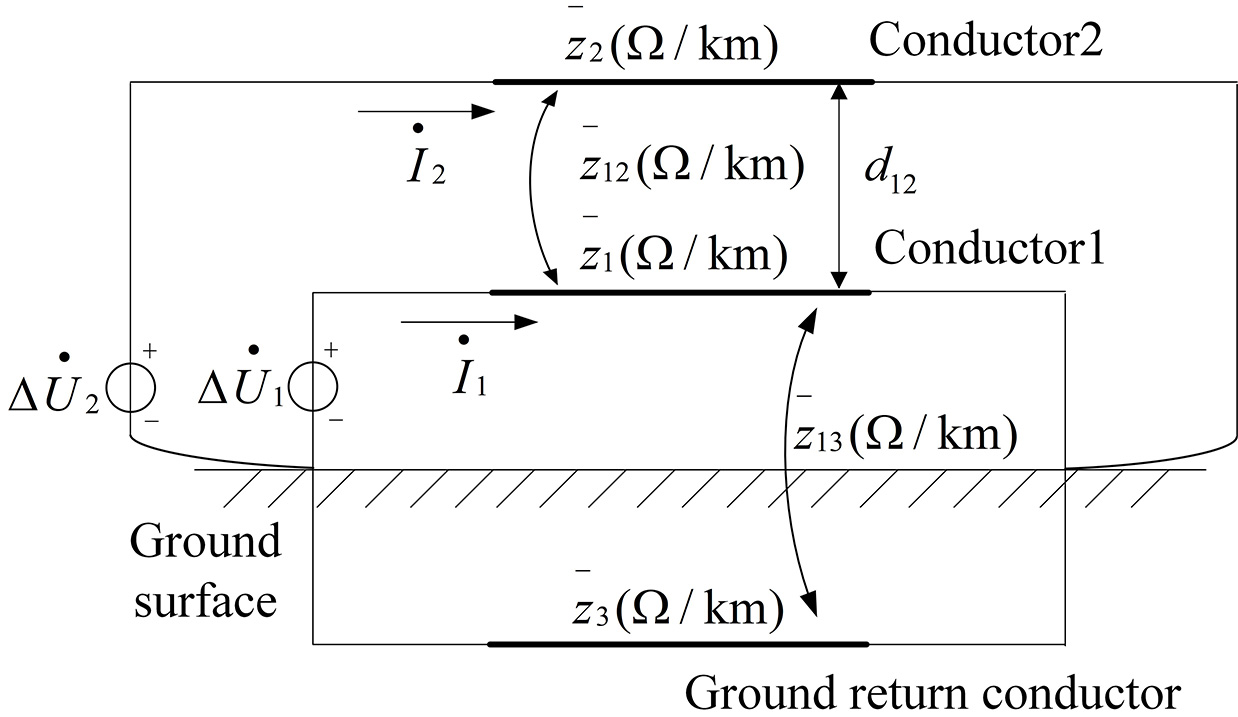
Figure 6. Equivalent model of a two-conductor-to-ground loop.
The self- and mutual impedances shown in the Figure 6 are calculated according to Equation (1)
where ri and rg denote the internal resistance of the conductor and the ground, Ω/km, respectively; Ri is the equivalent radius of the conductor, cm; dij represents the distance between conductors i and j, m; f is the current frequency, Hz; σ is the soil resistivity, 1/(Ω/cm); and Zii, Zij are the self- and mutual impedances of the conductors, Ω/km, respectively.
2.1.2. Admittance calculation
Let conductors i and j, as shown in Figure 7, be defined. Using methods from power system analysis, the self-potential coefficient Pii of the conductor and the mutual potential coefficient Pij between two conductors can be derived as follows:
where ɛ0 is the dielectric constant of air, ɛ0 = 8.854 × 10⁻⁹ (F/km); Dij is the image distance between conductors i and j, m; dij is the physical distance between conductors i and j, m; ri is the equivalent radius of conductor i, cm; and hi is the height of conductor i above the ground, m.
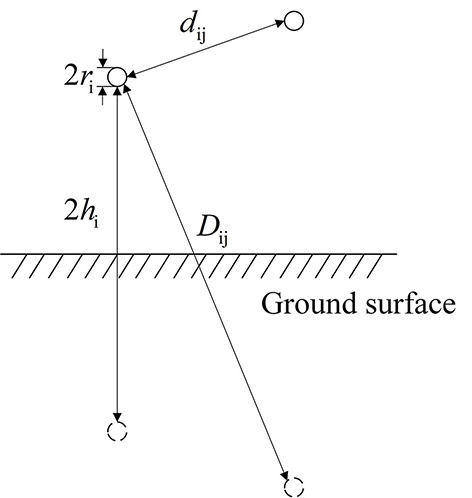
Figure 7. Conductor and its image.
2.2. PC off-line arc modeling
Under varying operating conditions, Cassie and Mayr each derived mathematical formulations for off-line arcs based on the principle of energy conservation. The two models differ in applicability: the Mayr model effectively represents arc behavior near the current zero-crossing, whereas the Cassie model better captures arcs sustained away from this region. To achieve a more comprehensive representation of arc dynamics, Habedank integrated the two models in series, forming a unified black-box arc model. The corresponding nonlinear governing equation is expressed as follows:
where gc represents the arc conductance of the Cassie model, S; gm represents the arc conductance of the Mayr model, S; and g represents the arc conductance of the Habedank model, S. This model is centered around arc conductance, where the arc is embedded in the circuit topology in the form of conductance, thereby influencing the changes in electrical parameters.
The parameters of the arc model, such as the voltage gradient P0 and dissipated power E0, vary dynamically and cannot be regarded as constants. To more accurately capture the electrical behavior of PC off-line arcing, this study incorporates the dynamic separation process of the PC system into the Habedank black-box model. For the arc voltage gradient, following the Cassie model assumption - which neglects energy dissipation at the electrodes and assumes dependence solely on arc length - the dissipated power E0 is reformulated as a function proportional to the arc length[28]. Moreover, previous experimental investigations have shown that dissipated power exhibits an exponential dependence on arc conductance. further demonstrated, through repeated AC switching arc experiments, that the dissipated power also varies with the arc length Larc. Accordingly, the extended expressions for both the voltage gradient and dissipated power are derived as follows:
By combining Equation (3) and Equation (4), the black-box arc model, considering the dynamic off-line process of the PC, can be expressed as
where τc and τm are the time constants of the Cassie arc model and the Mayr arc model, respectively. According to Liu et al.[28], k1 = 13, k2 = 1010, and α = β = 1.
2.3. Traction drive system modeling
The main circuit of a high-speed train AC traction drive system primarily consists of a pantograph, main circuit breaker, onboard transformer, traction converter, traction motor, and transmission system, as illustrated in Figure 8. The traction converter comprises a four-quadrant pulse rectifier, an intermediate DC link, and a traction inverter. During operation, the roof-mounted pantograph collects 25 kV, 50 Hz single-phase AC power from the traction network, which is transmitted through a vacuum circuit breaker (VCB) and high-voltage cables to the onboard transformer. The transformer steps the voltage down to
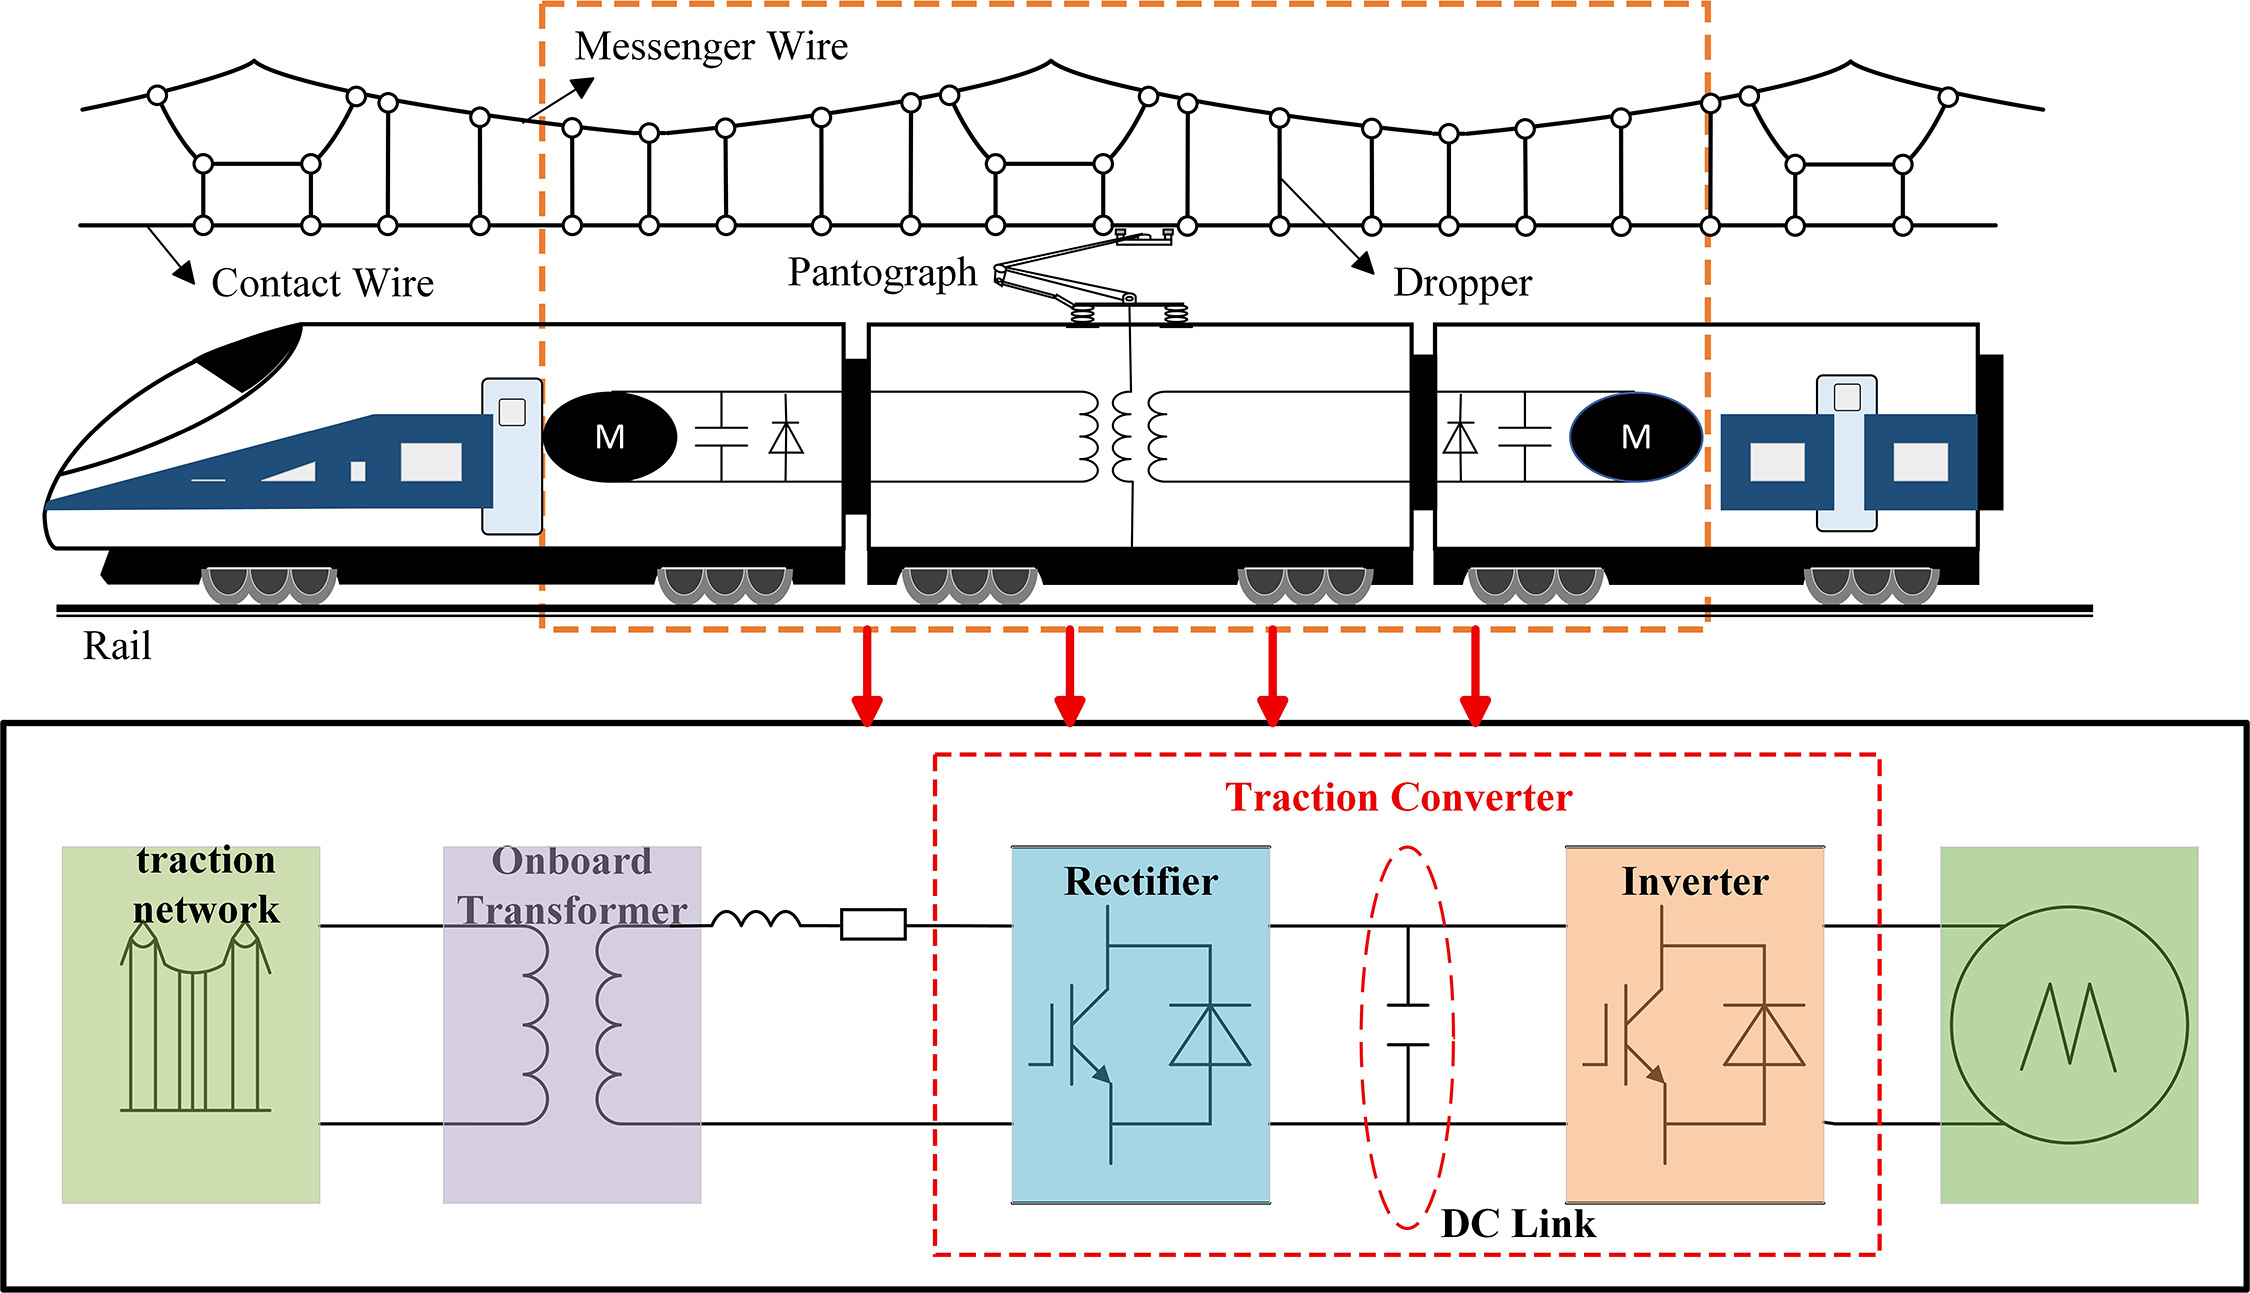
Figure 8. Schematic diagram of the traction drive system.
In conventional AC drive systems, rectifier control strategies typically include DC voltage control, AC control, indirect current control, and direct current control. In this study, a three-level four-quadrant rectifier adopts a transient current control strategy that integrates an outer voltage loop and an inner current loop, forming a dual closed-loop architecture. This configuration offers a simplified design, reduced DC-link voltage ripple, and enhanced dynamic response. The specific control function is expressed in[28]
where Kp and Ti denote the parameters of the PI controller; K represents the amplifier gain; Id and Ud are the DC-link current and voltage, respectively; UN(t) and UN denote the instantaneous and nominal values of the grid-side voltage; iN is the grid-side current; and Ud* and iN* are the reference values of the DC voltage and grid-side current, respectively.
For the inverter stage, SVPWM is implemented, with coordinated control by a dual closed-loop regulator and proportional-integral (PI) controller. The voltage outer loop regulates the rectifier input, while the current inner loop governs the inverter output. The PI controller accelerates transient response, minimizes steady-state error, and improves overall system stability and performance[28].
3. MODEL VALIDATION
Based on the experimentally measured waveform data reported by Gao et al.[29], the accuracy of the proposed arc model is validated through comparative analysis. Additionally, the constructed traction drive system model is verified using actual parameters from the high-speed train.
3.1. The traction network model validation
To validate the proposed model, this study conducts a comparative analysis between simulation results and measured current distribution data from a high-speed railway traction network. As shown in Figure 9, a high-current generator was connected to the messenger wire at a fixed feeding point, and the current values of current-carrying droppers were measured at various positions. A simulation model replicating the same structural configuration (three consecutive spans) was constructed under conditions matching the field test. The accuracy of the contact suspension model and its parameters was verified by comparing simulated and measured current values.
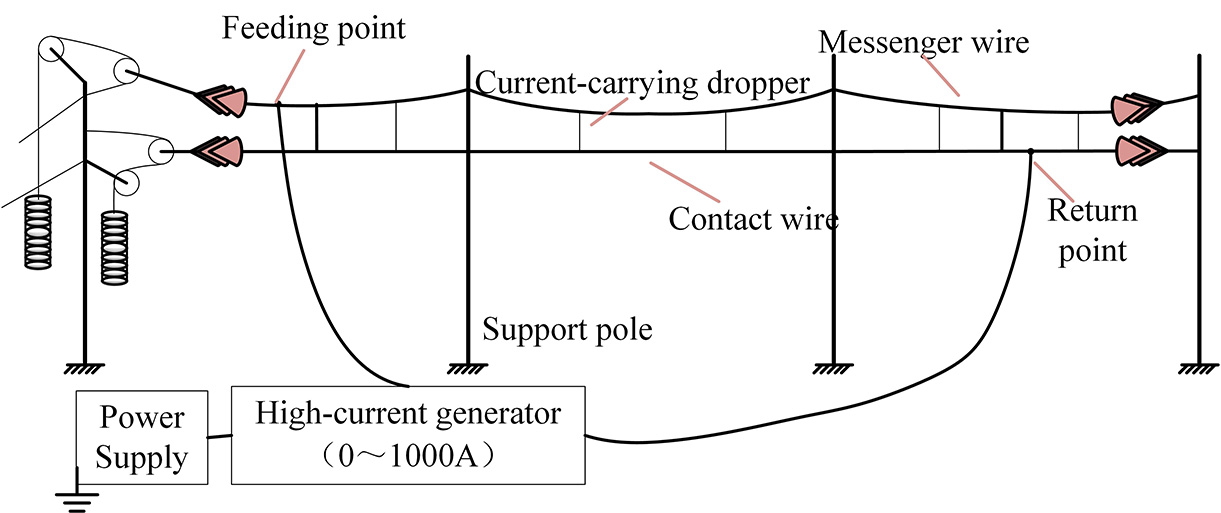
Figure 9. Schematic diagram of current distribution test for the contact suspension.
The relative error (Re) between the measured and simulated current data, calculated using Equation (7), is shown in Table 3. The current variation trend obtained from the simulation closely matches the measured results, with the deviation consistently maintained within 10%. Furthermore, as the current magnitude increases, the reliability of the contact suspension model improves, validating the accuracy and validity of the model.
where IS represents the measured current data, A, and IE represents the simulated current data, A.
Measured and simulated current error values
| Relative error | Relative error | ||
| Dropper 1 | - | Dropper 11 | 1.05% |
| Dropper 2 | - | Dropper 12 | 1.79% |
| Dropper 3 | 3.1% | Dropper 13 | 7.12% |
| Dropper 4 | 1.85% | Dropper 14 | 8.16% |
| Dropper 5 | 5.39% | Dropper 15 | 4.17% |
| Dropper 6 | 5.48% | Dropper 16 | 6.15% |
| Dropper 7 | 1.12% | Dropper 17 | - |
| Dropper 8 | 0.68% | Dropper 18 | - |
| Dropper 9 | 0.66% | Dropper 19 | - |
| Dropper 10 | 0.97% | Dropper 20 | - |
| Dropper 11 | 0.52% | Dropper 21 |
3.2. Arc model validation
This study validates the PC arc dynamic model through a combination of simulation and experimental measurements. If the simulation waveform and the measured waveform exhibit consistency in qualitative analysis, and the electrical external characteristics of the arc are closely matched, it indicates that the constructed PC arc dynamic model and the associated parameter settings can effectively describe the PC arc phenomenon. The model is reasonable, and the results are valid. Gao et al.[29] developed a PC arc testing system based on the arc generation mechanism. The system captures voltage and current signals during the pantograph-raising process through its integrated measurement modules. The schematic structure of the experimental setup is shown in Figure 10.
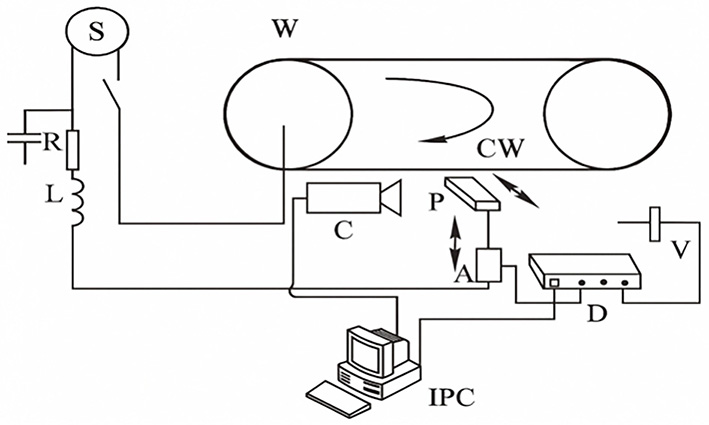
Figure 10. Schematic structure of the experimental setup.
A comparison between Figure 11 and the measured waveform by Gao et al.[29] shows that the simulated arc voltage waveform exhibits excellent agreement with the measured results in the overall trend. Within each cycle, the amplitudes of the arc initiation, sustaining, and extinction voltages gradually decrease with increasing arcing duration. These findings confirm that the extended formulations of the voltage gradient E0 and dissipated power P0, together with the selected parameters, provide an accurate representation of the dynamic behavior of PC off-line arcing.
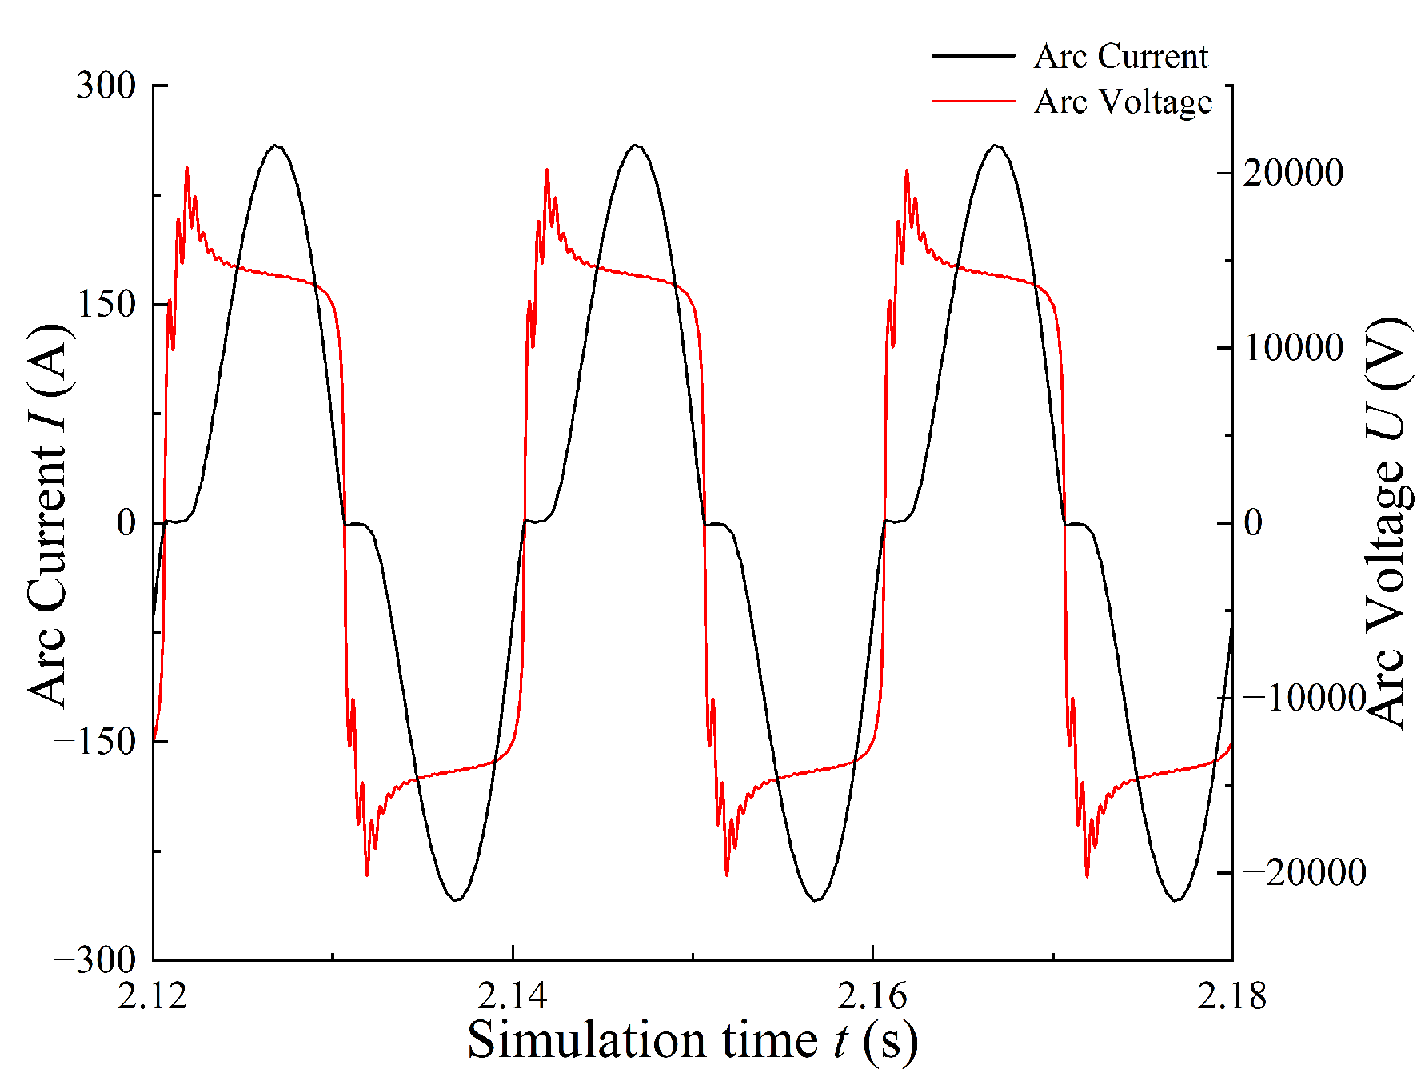
Figure 11. The arc waveform obtained from the simulation.
3.3. Traction drive system model validation
The traction drive system parameters are configured according to Table 4. The simulated waveforms obtained from the numerical model are presented in Figure 12.
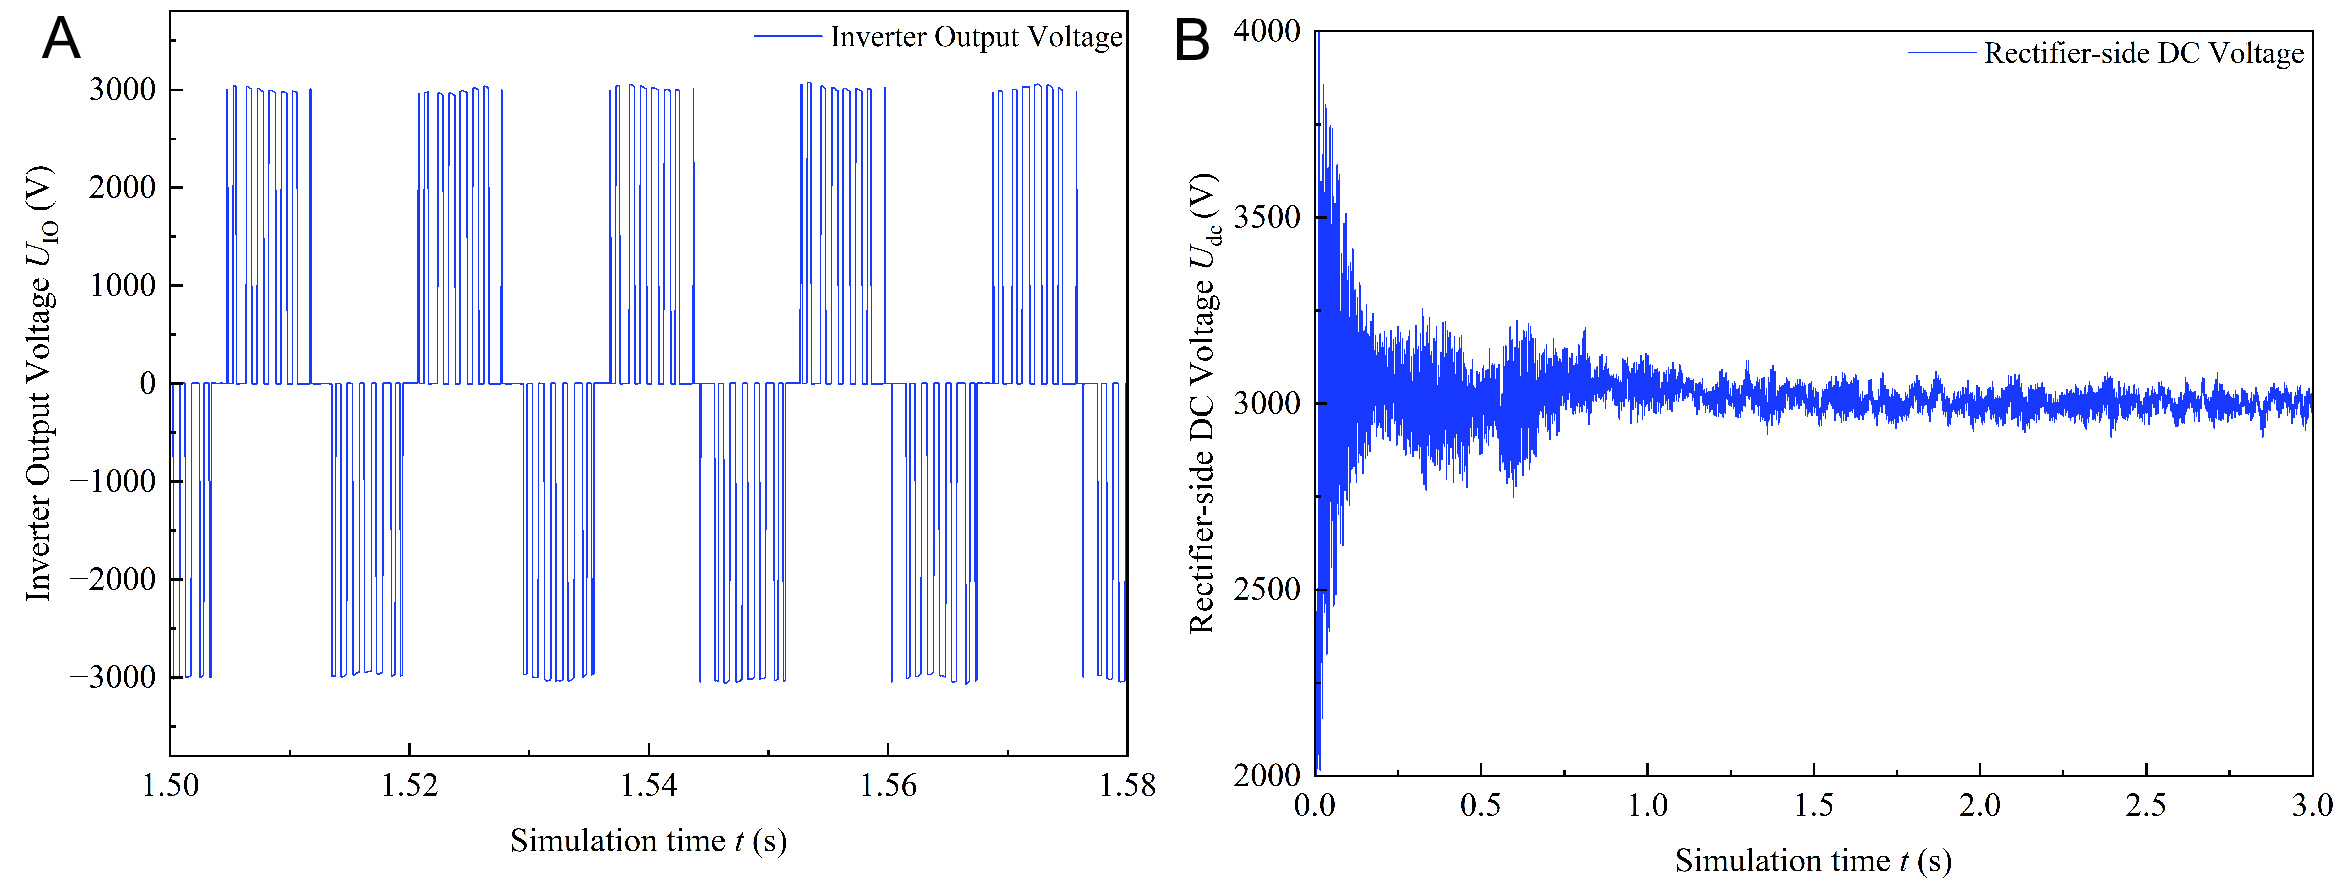
Figure 12. (A) represents the DC-side voltage of the rectifier, while (B) represents the output voltage of the inverter.
Parameter values of the traction drive system
| Parameters | Value |
| Secondary side leakage resistance | 0.145 Ω |
| Secondary side leakage inductance | 2.300 mH |
| DC link smoothing capacitor | 3.000 mF |
| Secondary filtering capacitor | 3.000 mF |
| Secondary filtering inductance | 0.840 mH |
As shown in Figure 12A, the output of the numerical model stabilizes at approximately 3,000 V, fully consistent with the rectifier parameters of the China Railway High-Speed 3 (CRH3) high-speed train traction converter. The inverter output waveform for one phase, presented in Figure 12B, exhibits a well-formed sinusoidal shape with an amplitude of 3,000 V and a frequency of 138 Hz, closely matching the actual operating conditions of the CRH3 train.
4. ANALYSIS OF THE ARC LENGTH THRESHOLD
The arc length threshold in this study refers to a critical arc length beyond which the electrical disturbances in the traction system - such as input voltage and DC-link voltage - exceed acceptable limits, resulting in significant degradation of system performance. In other words, it represents a critical parameter that characterizes the extent to which the arc affects the traction power supply system, serving as a boundary that reflects the balance between arc energy input and system stability. Here, LTin denotes the arc length threshold corresponding to the allowable fluctuation range of the input voltage at the onboard transformer, while LTdc refers to the arc length threshold associated with the permissible fluctuation range of the DC-link voltage.
To further investigate the influence of PC arc length on the traction drive system’s input voltage and other related electrical parameters under varying train speeds, and to determine the arc length threshold within the allowable disturbance range. The total simulation time (t) was set to 3 s, with an arcing duration (tarc) of
4.1. Considering the allowable disturbance range of the input voltage
To investigate the acceptable disturbance range of the PC off-line arcing threshold under different Uin, simulation calculations were conducted for five train speeds: 200, 225, 250, 275, and 300 km/h. For each scenario, arc lengths (L) were set to 0.5, 0.6, 0.7, 0.8, 0.9, and 1.0 cm. The input voltage at the secondary side of the traction drive system’s onboard transformer was measured for each of the six arc lengths at the same train speed. By comparing these measurements, the arc threshold for the PC system, considering the allowable disturbance range of the input voltage, was determined. Figure 13 illustrates the schematic of the Uin position. Simulation results are shown in Figures 14 and 15.
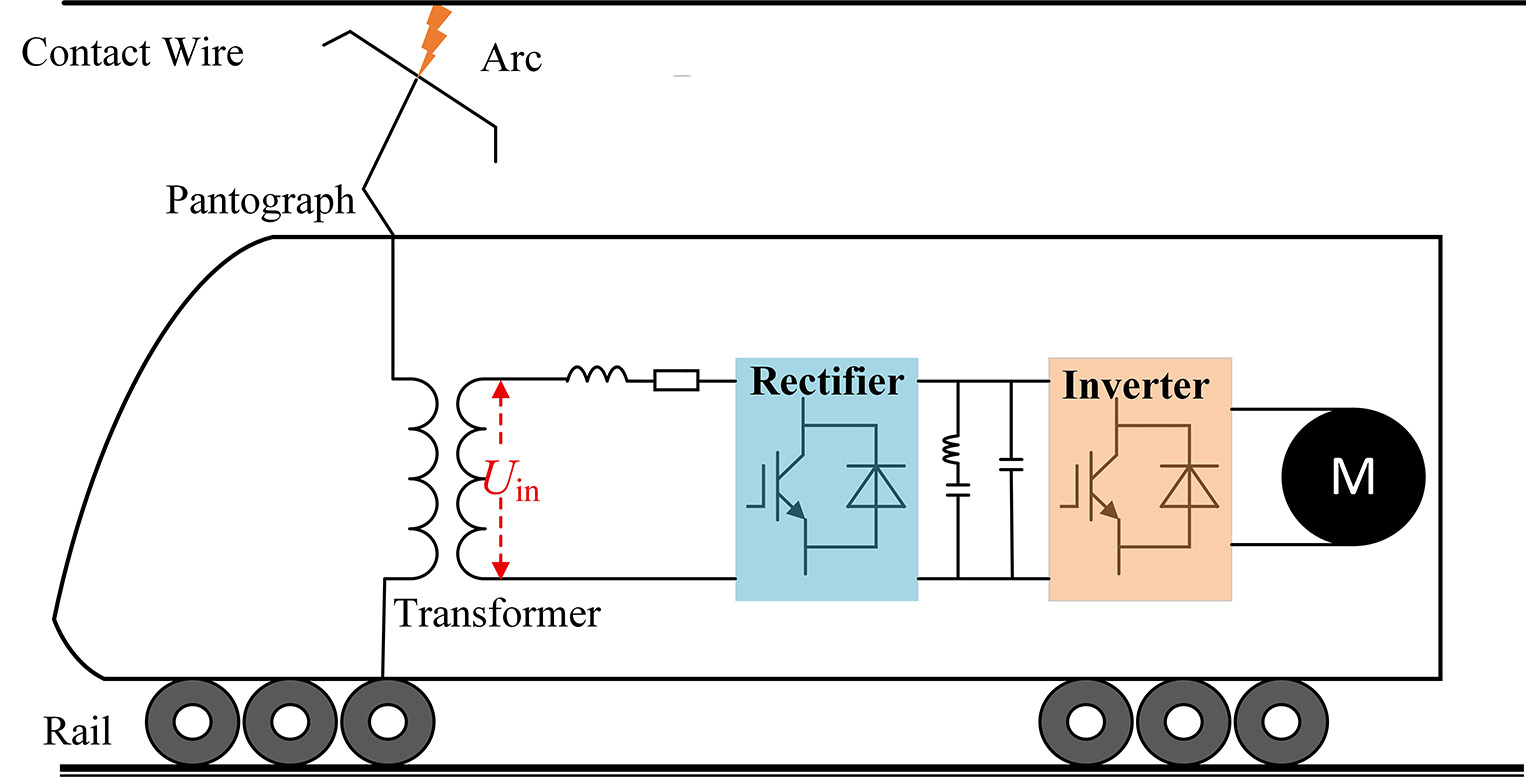
Figure 13. Schematic diagram of the onboard transformer secondary-side input voltage.
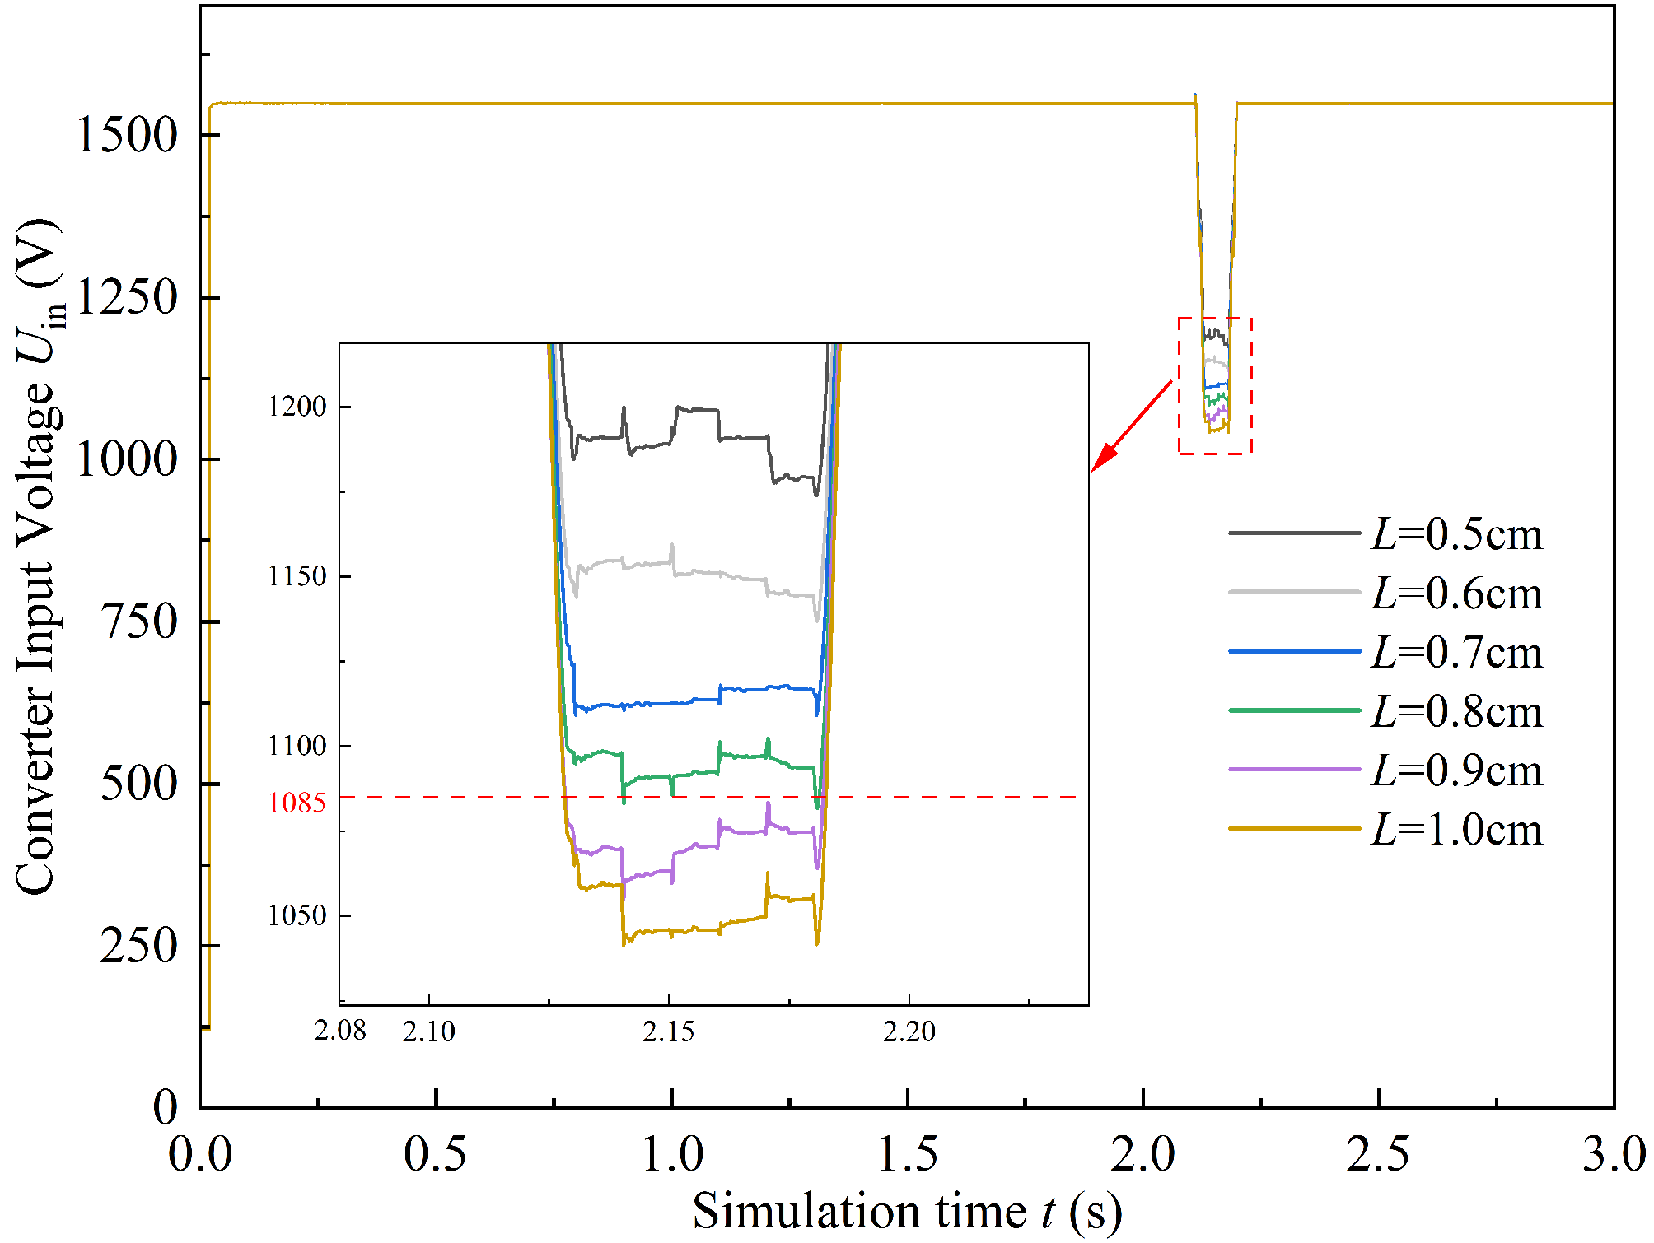
Figure 14. Disturbance of different arc lengths at V = 200 km/h.
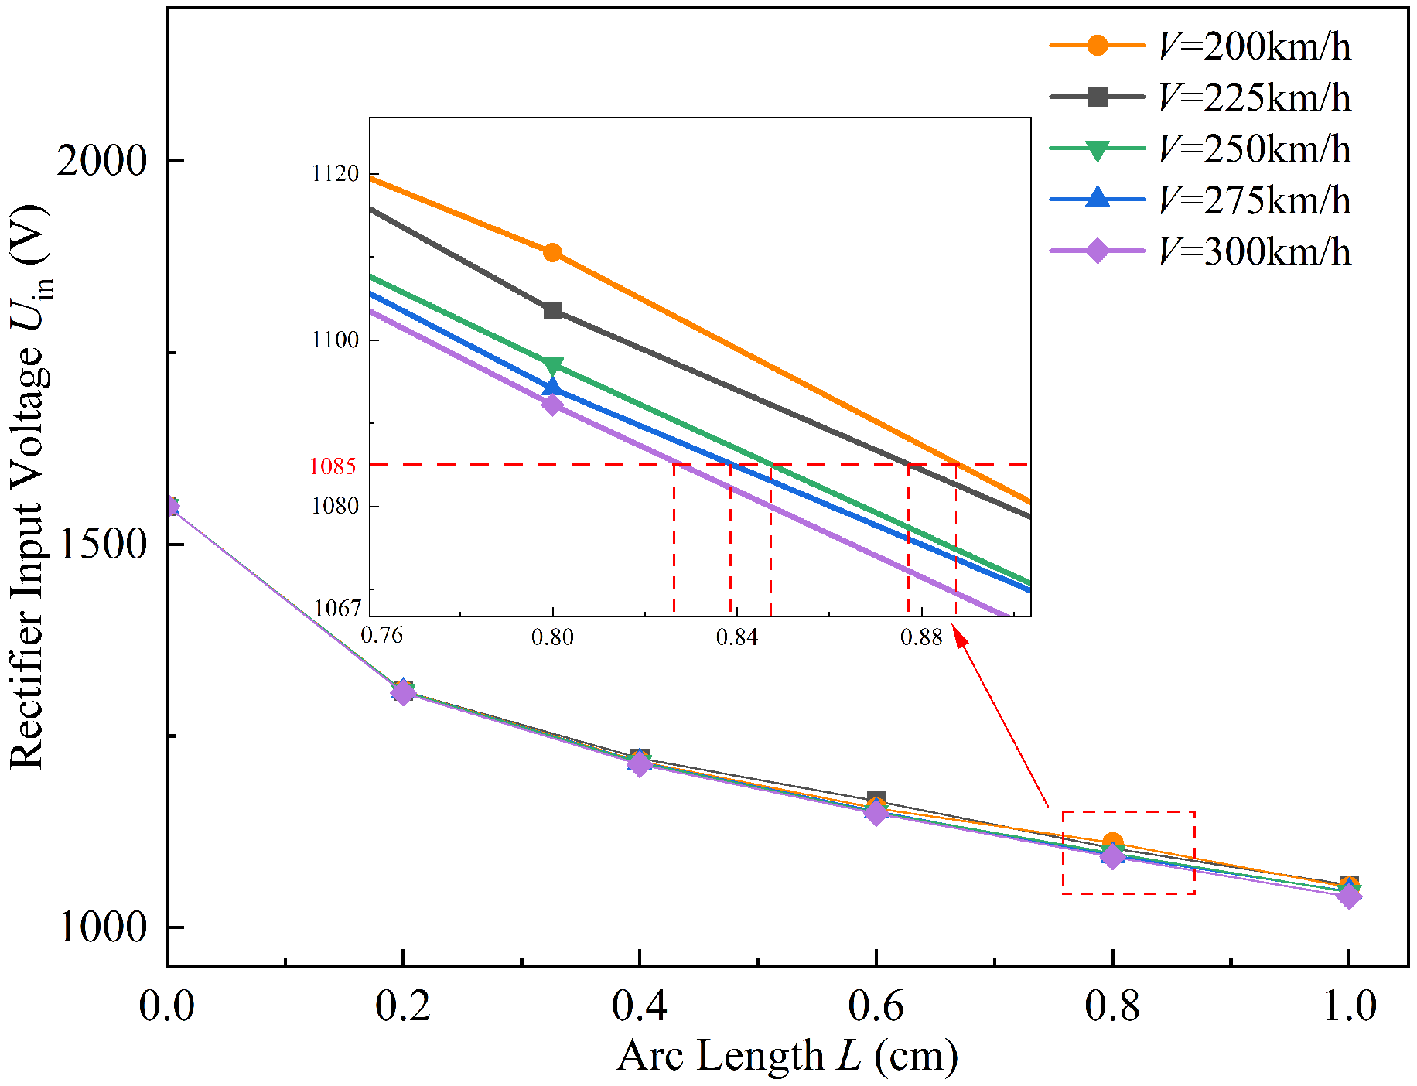
Figure 15. Corresponding arcing threshold under different vehicle speeds.
Figure 14 illustrates the input voltage waveforms under a train speed of 200 km/h, with arc lengths ranging from 0.5 cm to 1.0 cm. Figure 15 presents the corresponding input voltage values under five operating speeds. As shown in Figure 14, when PC separation occurs and arcing is initiated, the amplitude of Uin experiences varying degrees of attenuation. During recontact, Uin first drops sharply and then recovers, forming a transient voltage spike. According to the work by Zhang[30], the acceptable voltage range of the traction system is 1,085-1,922 V. From the enlarged view in Figure 14, the disturbance arc-length threshold at
The phenomena observed in Figures 14 and 15 result from the transformation of the initially stable “contact wire-pantograph-vacuum circuit breaker (VCB)-high-voltage cable-onboard transformer” path into a strongly nonlinear, time-varying circuit due to PC arcing. When the pantograph briefly loses contact with the catenary, an arc is self-generated to maintain current continuity, and the arc voltage increases with train speed, leading to a reduction in the transformer input voltage. Upon recontact, the sudden extinction of the arc and abrupt restoration of a metallic conduction path cause a transient current surge, producing a voltage spike. Moreover, as the train speed increases, aerodynamic loading, vehicle vibration, and catenary dynamics intensify, increasing the arc’s dissipated power. To sustain energy transfer across the arc channel, higher energy is required, resulting in greater voltage attenuation at the same arc length and a corresponding decrease in LTin.
4.2. Considering the fluctuation range of the DC side voltage
According to the EN50163:2020 standard and relevant manufacturer specifications, when the DC-link voltage fluctuation of the traction converter exceeds 5%, the traction inverter can still operate, but its performance begins to deteriorate. When the fluctuation exceeds 10%, significant torque and current pulsations occur, leading to degraded inverter performance and potentially compromising the long-term safe and stable operation of the train.
Therefore, this study defines the allowable fluctuation range of the DC-link voltage as 5%. Simulations are conducted under five train speeds with arc lengths set to 0.4, 0.6, 0.8, 1.0, 1.2, and 1.4 cm. The amplitude of DC voltage fluctuation (ΔUdc) during arcing is calculated to determine LTdc within the permissible DC-link voltage fluctuation range, as given in
where UdcN denotes the nominal DC-link voltage amplitude under normal operating conditions, which is 3,000V, and Udcarc represents the DC-link voltage during arcing, V.
Figure 16 shows the schematic diagram of the Udc measurement location. The simulation results are presented in Figures 17 and 18.
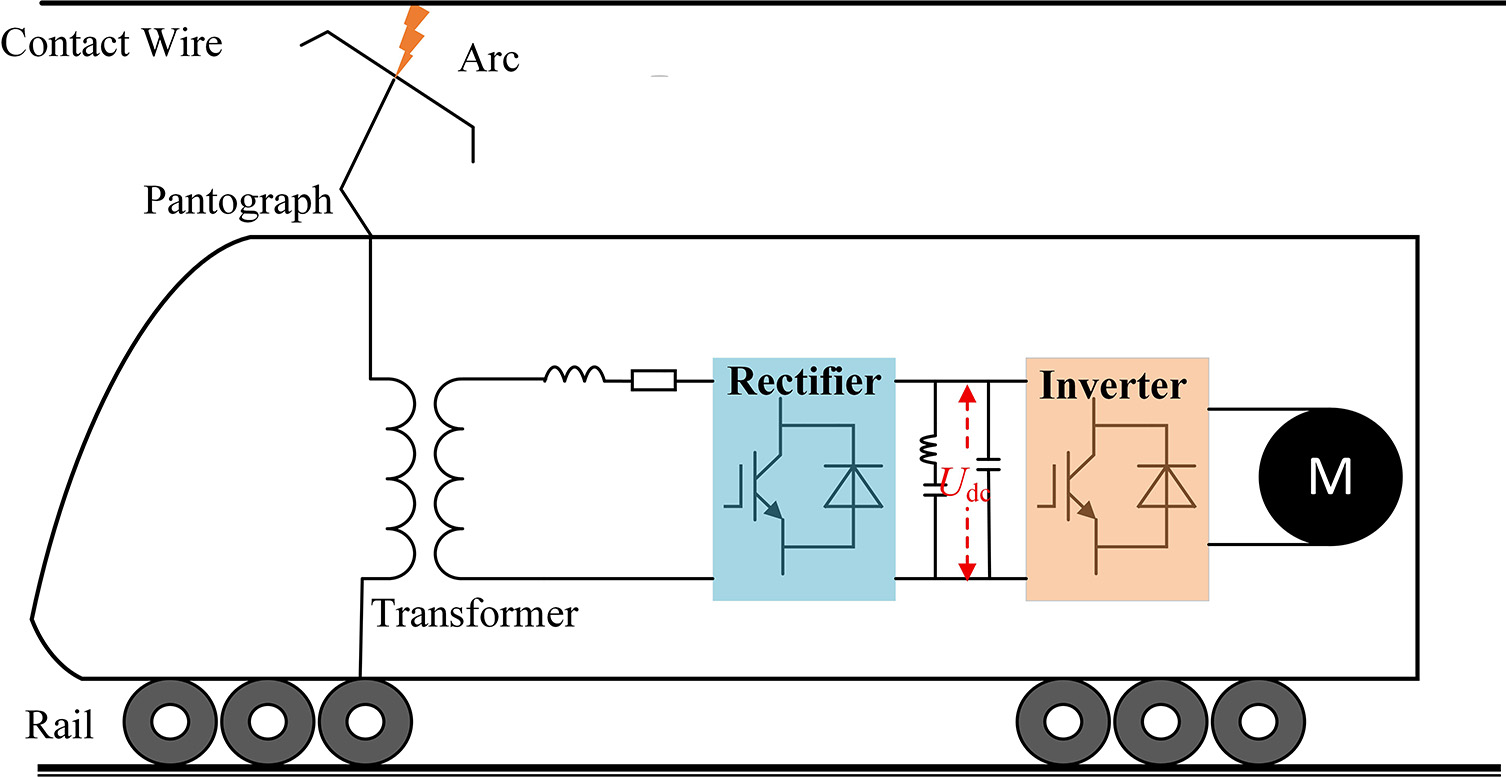
Figure 16. Schematic diagram of DC-side voltage.
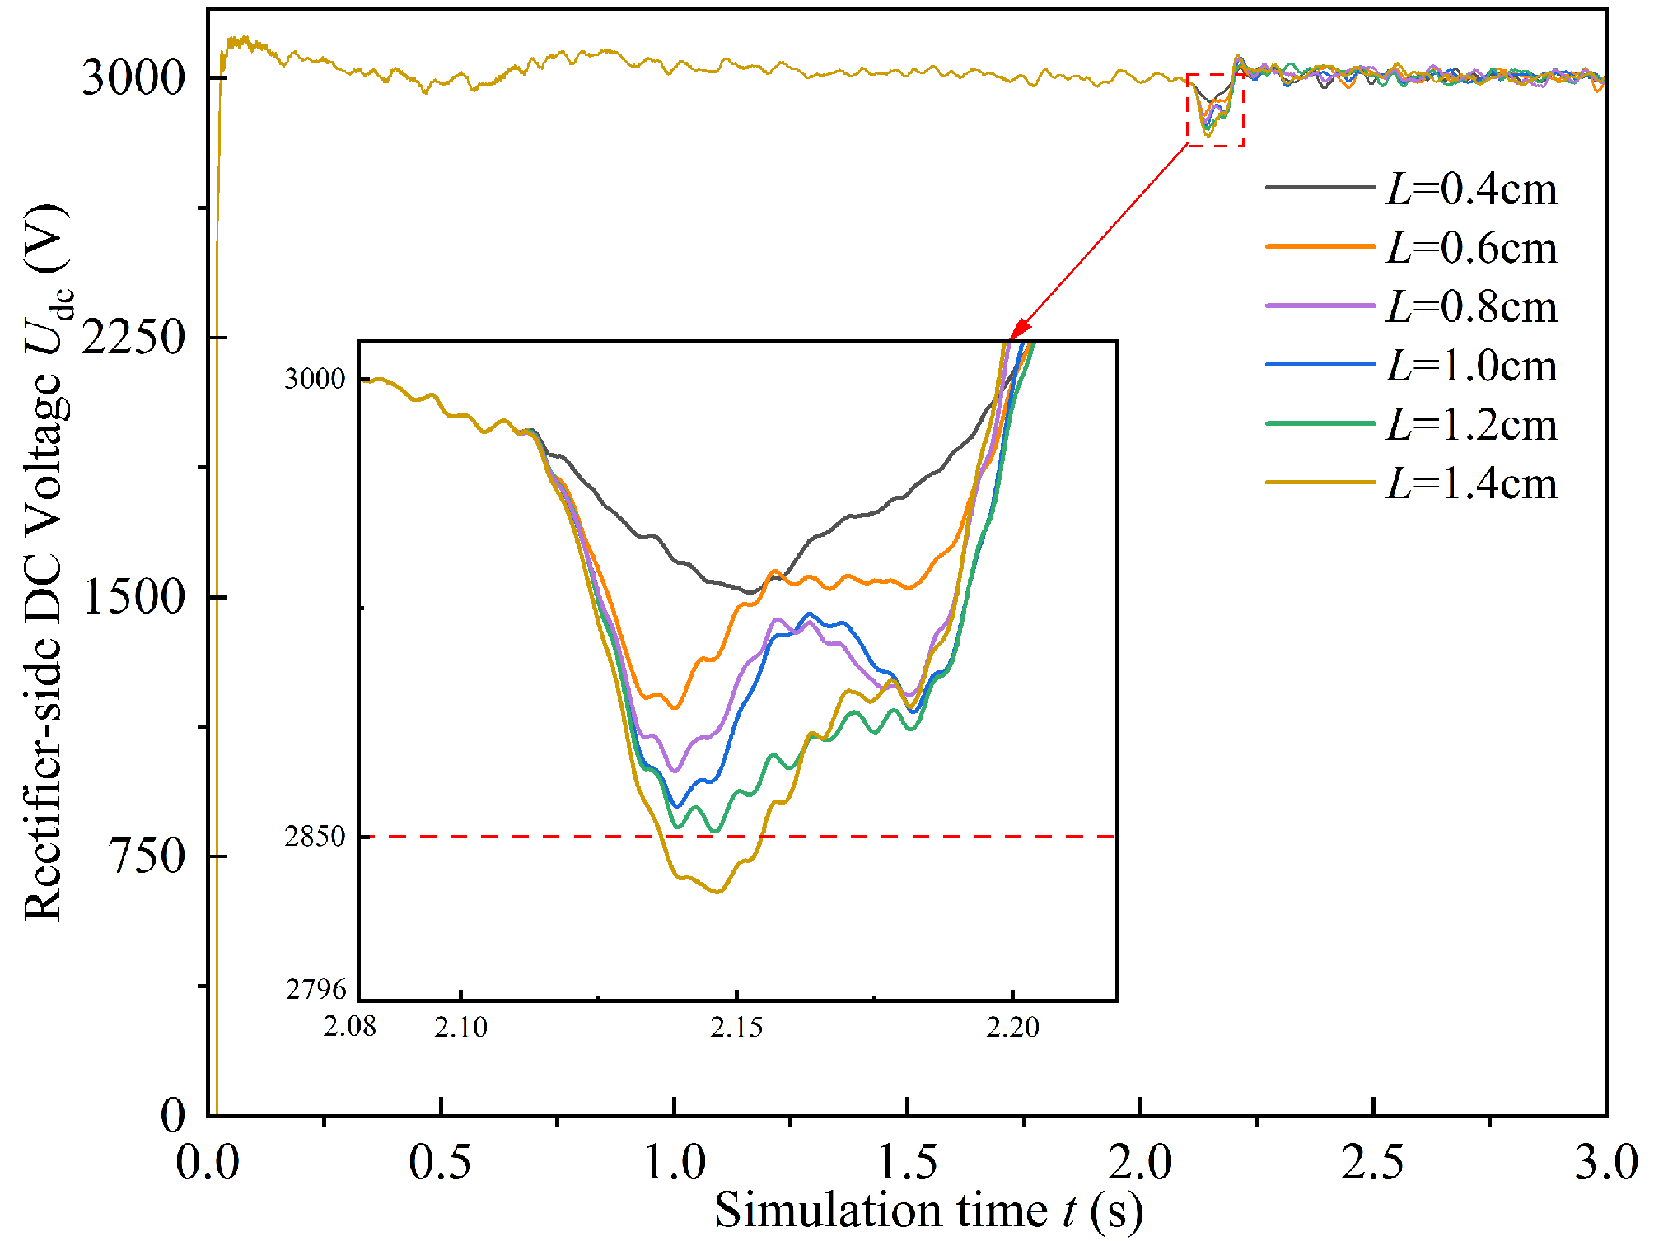
Figure 17. Disturbance of different arc lengths at V = 200 km/h.
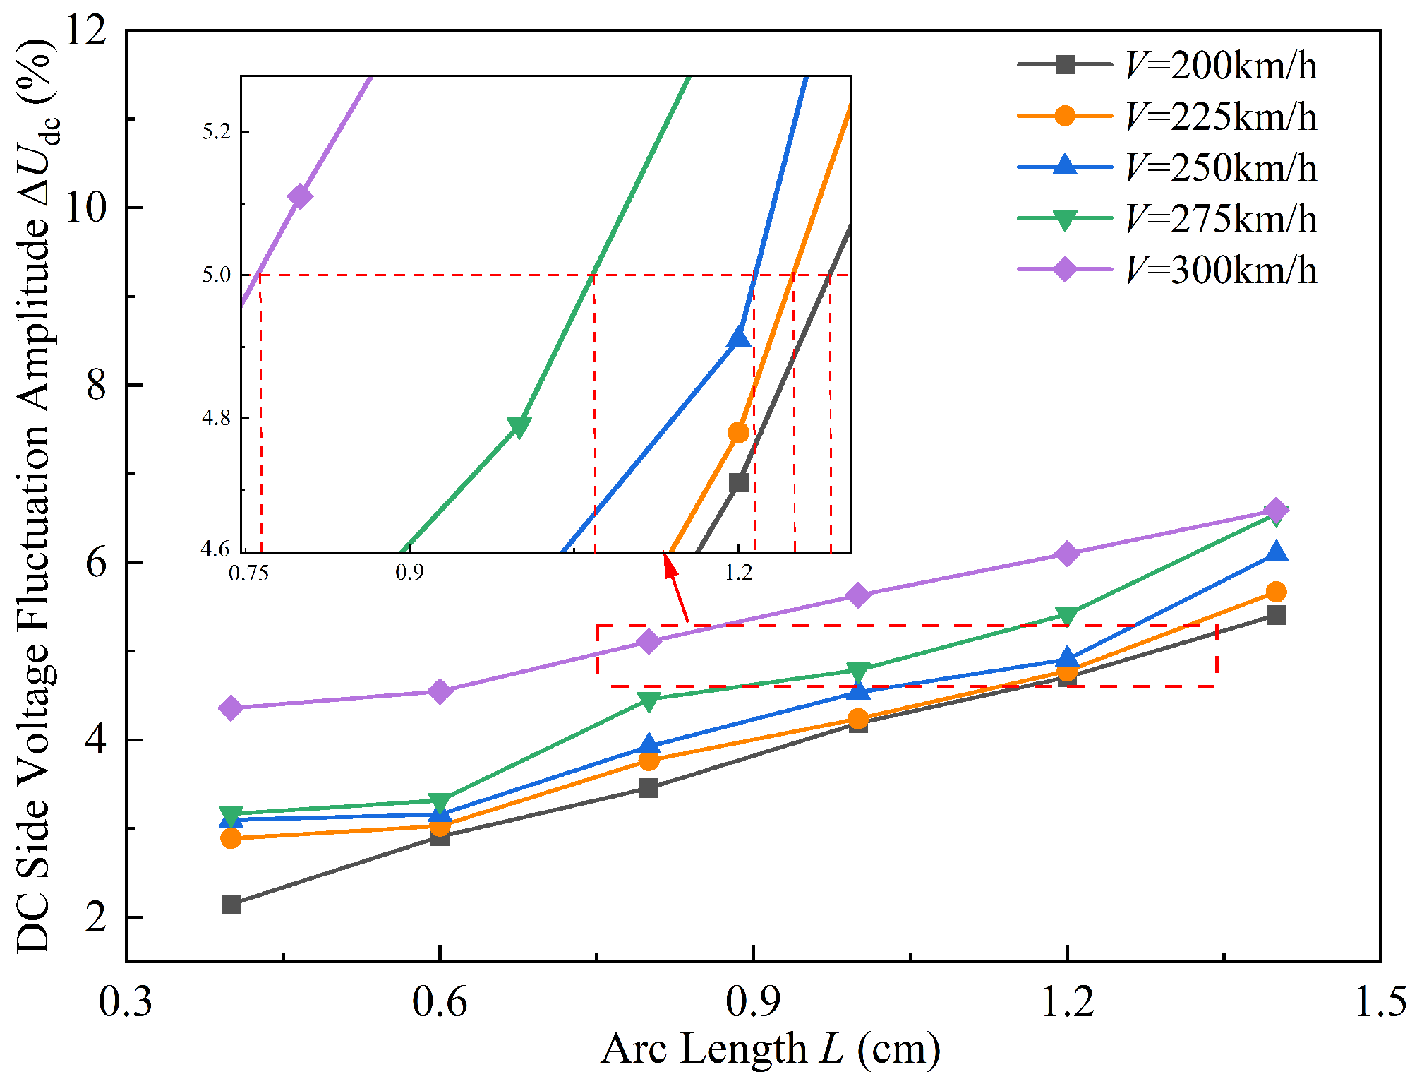
Figure 18. Corresponding arcing threshold under different vehicle speeds.
Figure 17 presents the rectifier-side DC voltage (Udc) waveforms for train operation at 200 km/h with arc lengths ranging from 0.4 cm to 1.4 cm, while Figure 18 shows the corresponding Udc values under five speed conditions. As shown in Figure 17, during the arcing period (2.1-2.18 s), Udc exhibits varying degrees of attenuation. The voltage drop reaches its maximum around t = 2.15 s for all six arc length conditions. Based on the 5% allowable fluctuation criterion for Udc, the enlarged view in Figure 17 indicates that the LTdc at
The observed phenomena in Figures 17 and 18 can be attributed to the nonlinear load characteristics of the PC arc, which introduce transient voltage oscillations and high-frequency noise into the system. During arcing, the discontinuous arc current and the repeated extinction-reignition process generate overvoltages and current spikes, which propagate through the rectifier and cause fluctuations in Udc. As the arc length increases, arc impedance and energy dissipation both rise, leading to enhanced ΔUdc. Meanwhile, higher train speeds amplify PC instability and arc intensity, inducing stronger transient disturbances and greater voltage drops. Consequently, for a fixed arc length, the DC voltage fluctuation becomes more pronounced at higher speeds. Furthermore, as the train speed increases from 200 km/h to 300 km/h, the LTdc corresponding to the 5% allowable voltage fluctuation decreases from 1.28 cm to 0.75 cm. This indicates that the traction converter becomes more sensitive to voltage disturbances at higher speeds. The combined effects of increased arc impedance, intensified dynamic interactions, and reduced voltage tolerance at high speeds lead to the nonlinear rise in ΔUdc and the decrease in LTdc.
Figure 19 summarizes the critical arc length thresholds corresponding to excessive voltage disturbances under different operating speeds. When the train speeds are 200, 225, 250, 275, and 300 km/h, the arc length thresholds corresponding to the LTin are 1.28, 1.25, 1.23, 1.07, and 0.75 cm, respectively, while those for the LTdc are 0.887, 0.878, 0.848, 0.839 and 0.826 cm. Notably, LTin drops sharply by 29.9% as the speed increases from 275 km/h to 300 km/h. Moreover, at speeds below 290 km/h, LTin remains consistently higher than LTdc. Both the numerical results and Figure 19 reveal a clear decreasing trend in arc length thresholds with increasing train speed. This indicates that as the operating speed rises, the traction drive system becomes more sensitive to PC arcing, reducing its tolerance to arc length. The primary reason lies in the intensified dynamic interaction between the pantograph and the catenary at higher speeds, which increases the arc voltage gradient and dissipated power, thereby amplifying voltage disturbances even for identical arc lengths. The sharp drop in LTin between 275 and 300 km/h suggests that beyond a critical speed, the voltage stability of the system deteriorates rapidly, and the impact of arc energy on the input voltage exhibits nonlinear amplification. Furthermore, the consistently higher LTin than LTdc below 290 km/h implies that the AC-side input voltage has a slightly greater tolerance to arc disturbances compared to the DC side, owing to the rectifier’s filtering effect and the dynamic response characteristics of the DC link. Overall, the formation and maintenance of an arc essentially represent a transient energy transfer process, in which the dissipated power directly reflects the intensity of energy injection from the arc into the traction system. Experimental observations indicate that as the arc length increases, the arc voltage rises while the arc current slightly decreases. The combined effect of these variations leads to a significant increase in the rate of energy injection per unit time, causing over-limit voltage fluctuations at the input terminal of the traction system. This phenomenon reveals a pronounced nonlinear coupling relationship between arc energy and the energy dynamics of the traction system. Specifically, under low-speed conditions, the system’s filtering and inductive energy storage components can absorb part of the arc energy, resulting in relatively small voltage fluctuations. In contrast, under high-speed conditions, the arc length varies more dramatically, and the rate of change in arc power is higher, preventing the input voltage disturbance from attenuating within a short time and thereby producing larger transient overvoltage responses.
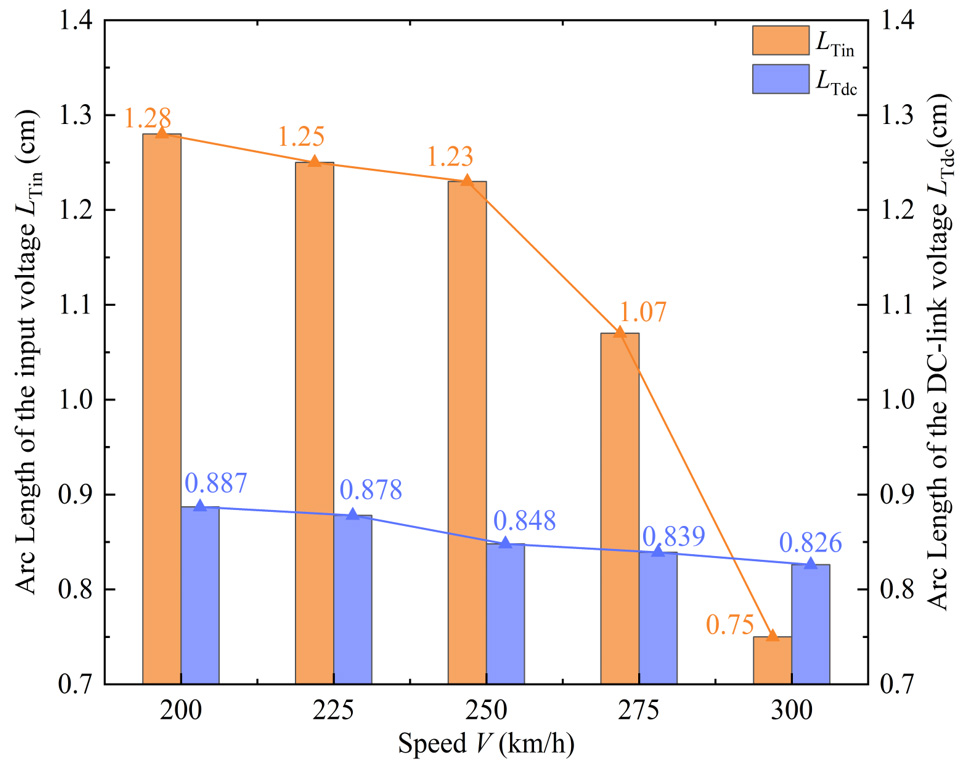
Figure 19. Arc length threshold.
5. CONCLUSIONS
In the high-speed train traction drive system, for the arc length threshold of PC off-line arcing under different operating conditions, this paper investigates the impact of arc length on the secondary side input voltage of the onboard transformer and the rectifier-side DC voltage fluctuation through simulation calculations. It obtains the corresponding arc length thresholds for each train speed. As a method for detecting pantograph-catenary arcing, the threshold-based approach offers key advantages such as structural simplicity and clear physical interpretability. It relies on directly measurable electrical quantities - such as voltage or current - and identifies arcing states by defining disturbance thresholds. This eliminates the need for complex algorithms or large-scale data training, ensuring high engineering feasibility, rapid response, and strong applicability in real-time monitoring systems. The main conclusions are as follows:
(1) An extended AT traction network model incorporating components such as the messenger wire was developed. Its accuracy was validated against measured data, showing a simulation-experiment error of less than 5%, indicating strong engineering reliability in current distribution and electrical parameter estimation. Building upon the Habedank black-box arc model, the arc voltage and dissipated power parameters were further refined based on the dynamic pantograph-catenary detachment characteristics. A coupled simulation framework of the “traction network-arc-traction drive system” was then established. The validity of the proposed model was confirmed by comparing the simulated waveforms with experimental measurements, demonstrating strong agreement between the two.
(2) At a train speed of 200 km/h, increasing the arc length from 0.5 cm to 1.0 cm caused the input voltage fluctuation amplitude to rise from 2.2%-5.4%, and the DC-link voltage fluctuation from 2.15%-5.41%. When the train speed increased from 200 km/h to 300 km/h under the same arc length, the DC-link voltage fluctuation rose further to 6.59%. These results demonstrate that higher train speeds significantly increase system sensitivity to arc disturbances, resulting in more severe voltage attenuation at the same arc length.
(3) Under different train speed conditions, the corresponding PC arc length thresholds are derived by considering the allowable fluctuation ranges for the input voltage and DC side voltage. When the train speed increased from 200 km/h to 300 km/h, the threshold arc length for input voltage disturbance (LTin) decreased from 1.28 cm to 0.75 cm, while the threshold for DC-link voltage disturbance (LTdc) dropped from 0.887 cm to 0.826 cm. The results show that as the train speed increases from 200 km/h to 300 km/h, the arc threshold gradually decreases. That is, the higher the speed, the smaller the critical length corresponding to the arc's impact on the traction power supply system.
DECLARATIONS
Authors’ contributions
Made substantial contributions to conception and design of the study and performed data analysis and interpretation: Chen, J.; Wang, X.
Performed data acquisition and provided administrative, technical, and material support: Song, Y.
Availability of data and materials
The sources of the original supporting data and experimental datasets used in this study, as well as the analysis methods, are available from the corresponding author upon reasonable request.
Financial support and sponsorship
This work was supported by the China State Railway Group Co., Ltd (No. L2025G002), the Sichuan Science and Technology Program (No. 2026YFHZ0062), the National Natural Science Foundation of China (No. 52477129, U2468230, U2468229).
Conflicts of interest
All authors declared that there are no conflicts of interest.
Ethical approval and consent to participate
Not applicable.
Consent for publication
Not applicable.
Copyright
© The Author(s) 2026.
REFERENCES
1. Tang, Y.; Li, F.; Zhou, C.; Wang, Y.; Zhu, F. Research on the model and transient characteristics of the pantograph-catenary arc in different sections of power supply lines. ACES. J. 2023, 38, 109-16.
2. Cheng, Y.; Liu, Z.; Huang, K. Transient analysis of electric arc burning at insulated rail joints in high-speed railway stations based on state-space modeling. IEEE. Trans. Transp. Electrific. 2017, 3, 750-61.
3. Pan, L.; Yi, X.; Xing, T.; et al. Arc erosion behaviors of pantograph of high-speed train during its rise and fall processes. IEEE. Access. 2025, 13, 165144-56.
4. Xu, Z.; Song, Y.; Xiong, J.; Lin, G.; Liu, Z. Flexible pantograph collector modeling and its effects in high-speed catenary-pantograph interaction. IEEE. Trans. Instrum. Meas. 2025, 74, 1-11.
5. Yang, H.; Liu, Z.; Cui, H.; et al. An electrified railway catenary component anomaly detection frame based on invariant normal region prototype with segment anything model. IEEE. Trans. Transp. Electrific. 2026, 12, 1391-402.
6. Hung, X.; Gao, G.; Wu, G. Influence of pantograph-catenary disconnection on traction system. High. Voltage. Apparatus. 2019, 55, 102-107, 116.
7. Wang, X.; Guo, F.; Li, F.; Liu, Z.; Kou, J. Influence of surface roughness of sliding friction pairs on pantograph-catenary contact resistance. IEEE. Trans. Transp. Electrific. 2024, 10, 10208-18.
8. Lin, F.; Wang, X.; Yang, Z.; et al. Analysis of electrical characteristics of the four-quadrant converter in high speed train considering pantograph-catenary arcing. Proc. Inst. Mech. Eng. Part. F. 2017, 231, 185-97.
9. Yu, X.; Song, M.; Wang, Z. Simulation study on surface temperature distribution of collector strip material under pantograph-catenary arc of urban rail. IEEE. Access. 2023, 11, 68358-65.
10. Wang, Z.; Li, Z.; Han, C.; Guo, F. Mathematical model of pantograph arc based on probability distribution of arc parameters. IEEE. Trans. Transp. Electrific. 2023, 9, 2026-37.
11. Huang, K.; Lin, G.; Liu, Z.; Yang, Y. Research on transient over-voltages of high-speed train passing articulated split-section insulator. IEEE. Trans. Transp. Electrific. 2023, 9, 1664-82.
12. Li, Z.; Chen, J.; Deng, J. A feedforward air-conditioning energy management method for high-speed railway sleeper compartment. Complex. Eng. Syst. 2021, 1, 10.
13. Chen, X.; Li, G.; Liu, Z.; Deng, Y. Modeling, verification and stability analysis of dual-port equivalent traction network considering distribution parameters. Elect. Power. Autom. Equip. 2022, 42, 179-85.
14. Brenna, M.; Foiadelli, F.; Zaninelli, D. Electromagnetic model of high speed railway lines for power quality studies. IEEE. Trans. Power. Syst. 2010, 25, 1301-8.
15. Dolara, A.; Gualdoni, M.; Leva, S. Impact of high-voltage primary supply lines in the 2 × 25 kV-50 Hz railway system on the equivalent impedance at pantograph terminals. IEEE. Trans. Power. Del. 2012, 27, 164-75.
16. Huang, K.; Liu, Z.; Su, D.; Zheng, Z. A traction network chain-circuit model with detailed consideration of integrated grounding system in tunnel path. IEEE. Trans. Transp. Electrific. 2019, 5, 535-51.
17. Artale, G.; Cataliotti, A.; Nuccio, V. C. S.; et al. A set of indicators for arc faults detection based on low frequency harmonic analysis. In 2016 IEEE International Instrumentation and Measurement Technology Conference Proceedings. Taipei; 23-26 May 2016.
18. Lakhani, A. I.; Chowdhury, M. A.; Lu, Q. Stability-preserving automatic tuning of PID control with reinforcement learning. Complex. Eng. Syst. 2022, 2, 3.
19. Artale, G.; Cataliotti, A.; Cosentino, V.; Di, Cara. D.; Nuccio, S.; Tine, G. Arc fault detection method based on CZT low-frequency harmonic current analysis. IEEE. Trans. Instrum. Meas. 2017, 66, 888-96.
20. Chen, R.; Lin, Y.; Jin, T. High-speed railway pantograph-catenary anomaly detection method based on depth vision neural network. IEEE. Trans. Instrum. Meas. 2022, 71, 1-10.
21. Chang, L.; Pan, X.; Fu, Z.; Li, D.; Liu, S.; Zhang, G. Robust online dynamic detection method for PAC operational status of high-speed trains based on key point positioning. IEEE. Trans. Instrum. Meas. 2022, 71, 1-14.
22. Gao, G.; Yan, X.; Yang, Z.; Wei, W.; Hu, Y.; Wu, G. Pantograph-catenary arcing detection based on electromagnetic radiation. IEEE. Trans. Electromagn. Compat. 2019, 61, 983-9.
23. Yan, J.; Li, Q.; Duan, S. A simplified current feature extraction and deployment method for DC series arc fault detection. IEEE. Trans. Ind. Electron. 2024, 71, 625-34.
24. Li, B.; Luo, C.; Wang, Z. Application of GWO-SVM algorithm in arc detection of pantograph. IEEE. Access. 2020, 8, 173865-73.
25. Du, Y.; Jiao, Y.; Li, H.; Chen, Q. Pantograph-catenary arc detection based on electrical parameter transient variations correlated with current-zero arc phenomena. IEEE. Trans. Instrum. Meas. 2025, 74, 1-11.
26. Yang, G.; Kong, G.; Shen, X. Arc recognition for pantograph-catenery system of railway using current. Measurement 2025, 251, 117304.
27. Wei, W.; Zeng, K.; Wan, Y.; Xia, L.; Zhang, H.; Yang, Z. A pantograph-catenary arcing detection method based on the fusion of current and electromagnetic radiation. Eng. Res. Express. 2025, 7, 035346.
28. Liu, Z.; Zhou, H.; Huang, K.; Song, Y.; Zheng, Z.; Cheng, Y. Extended black-box model of pantograph-catenary detachment arc considering pantograph-catenary dynamics in electrified railway. IEEE. Trans. Ind. Appl. 2019, 55, 776-85.
29. Gao, G.; Hao, J.; Gu, Z.; Wu,
30. Zhang, S. CRH2 electric multiple units; China Railway Publishing House, 2008. Available from: https://www.tdpress.com/cms/book/19096 [Last accessed on 28 Jan 2026].
Cite This Article
How to Cite
Download Citation
Export Citation File:
Type of Import
Tips on Downloading Citation
Citation Manager File Format
Type of Import
Direct Import: When the Direct Import option is selected (the default state), a dialogue box will give you the option to Save or Open the downloaded citation data. Choosing Open will either launch your citation manager or give you a choice of applications with which to use the metadata. The Save option saves the file locally for later use.
Indirect Import: When the Indirect Import option is selected, the metadata is displayed and may be copied and pasted as needed.
About This Article
Copyright

Data & Comments
Data
0


Comments
Comments must be written in English. Spam, offensive content, impersonation, and private information will not be permitted. If any comment is reported and identified as inappropriate content by OAE staff, the comment will be removed without notice. If you have any queries or need any help, please contact us at [email protected].