Longitudinal associations of domain-specific subjective cognitive decline with plasma Alzheimer’s biomarkers and cognitive change
 0
0 Abstract
Aim: The longitudinal relationships among domain-specific subjective cognitive decline (SCD), declines in objective cognitive domains (OCD), plasma Alzheimer’s disease (AD) biomarkers, and incidence of cognitive impairment remain unclear.
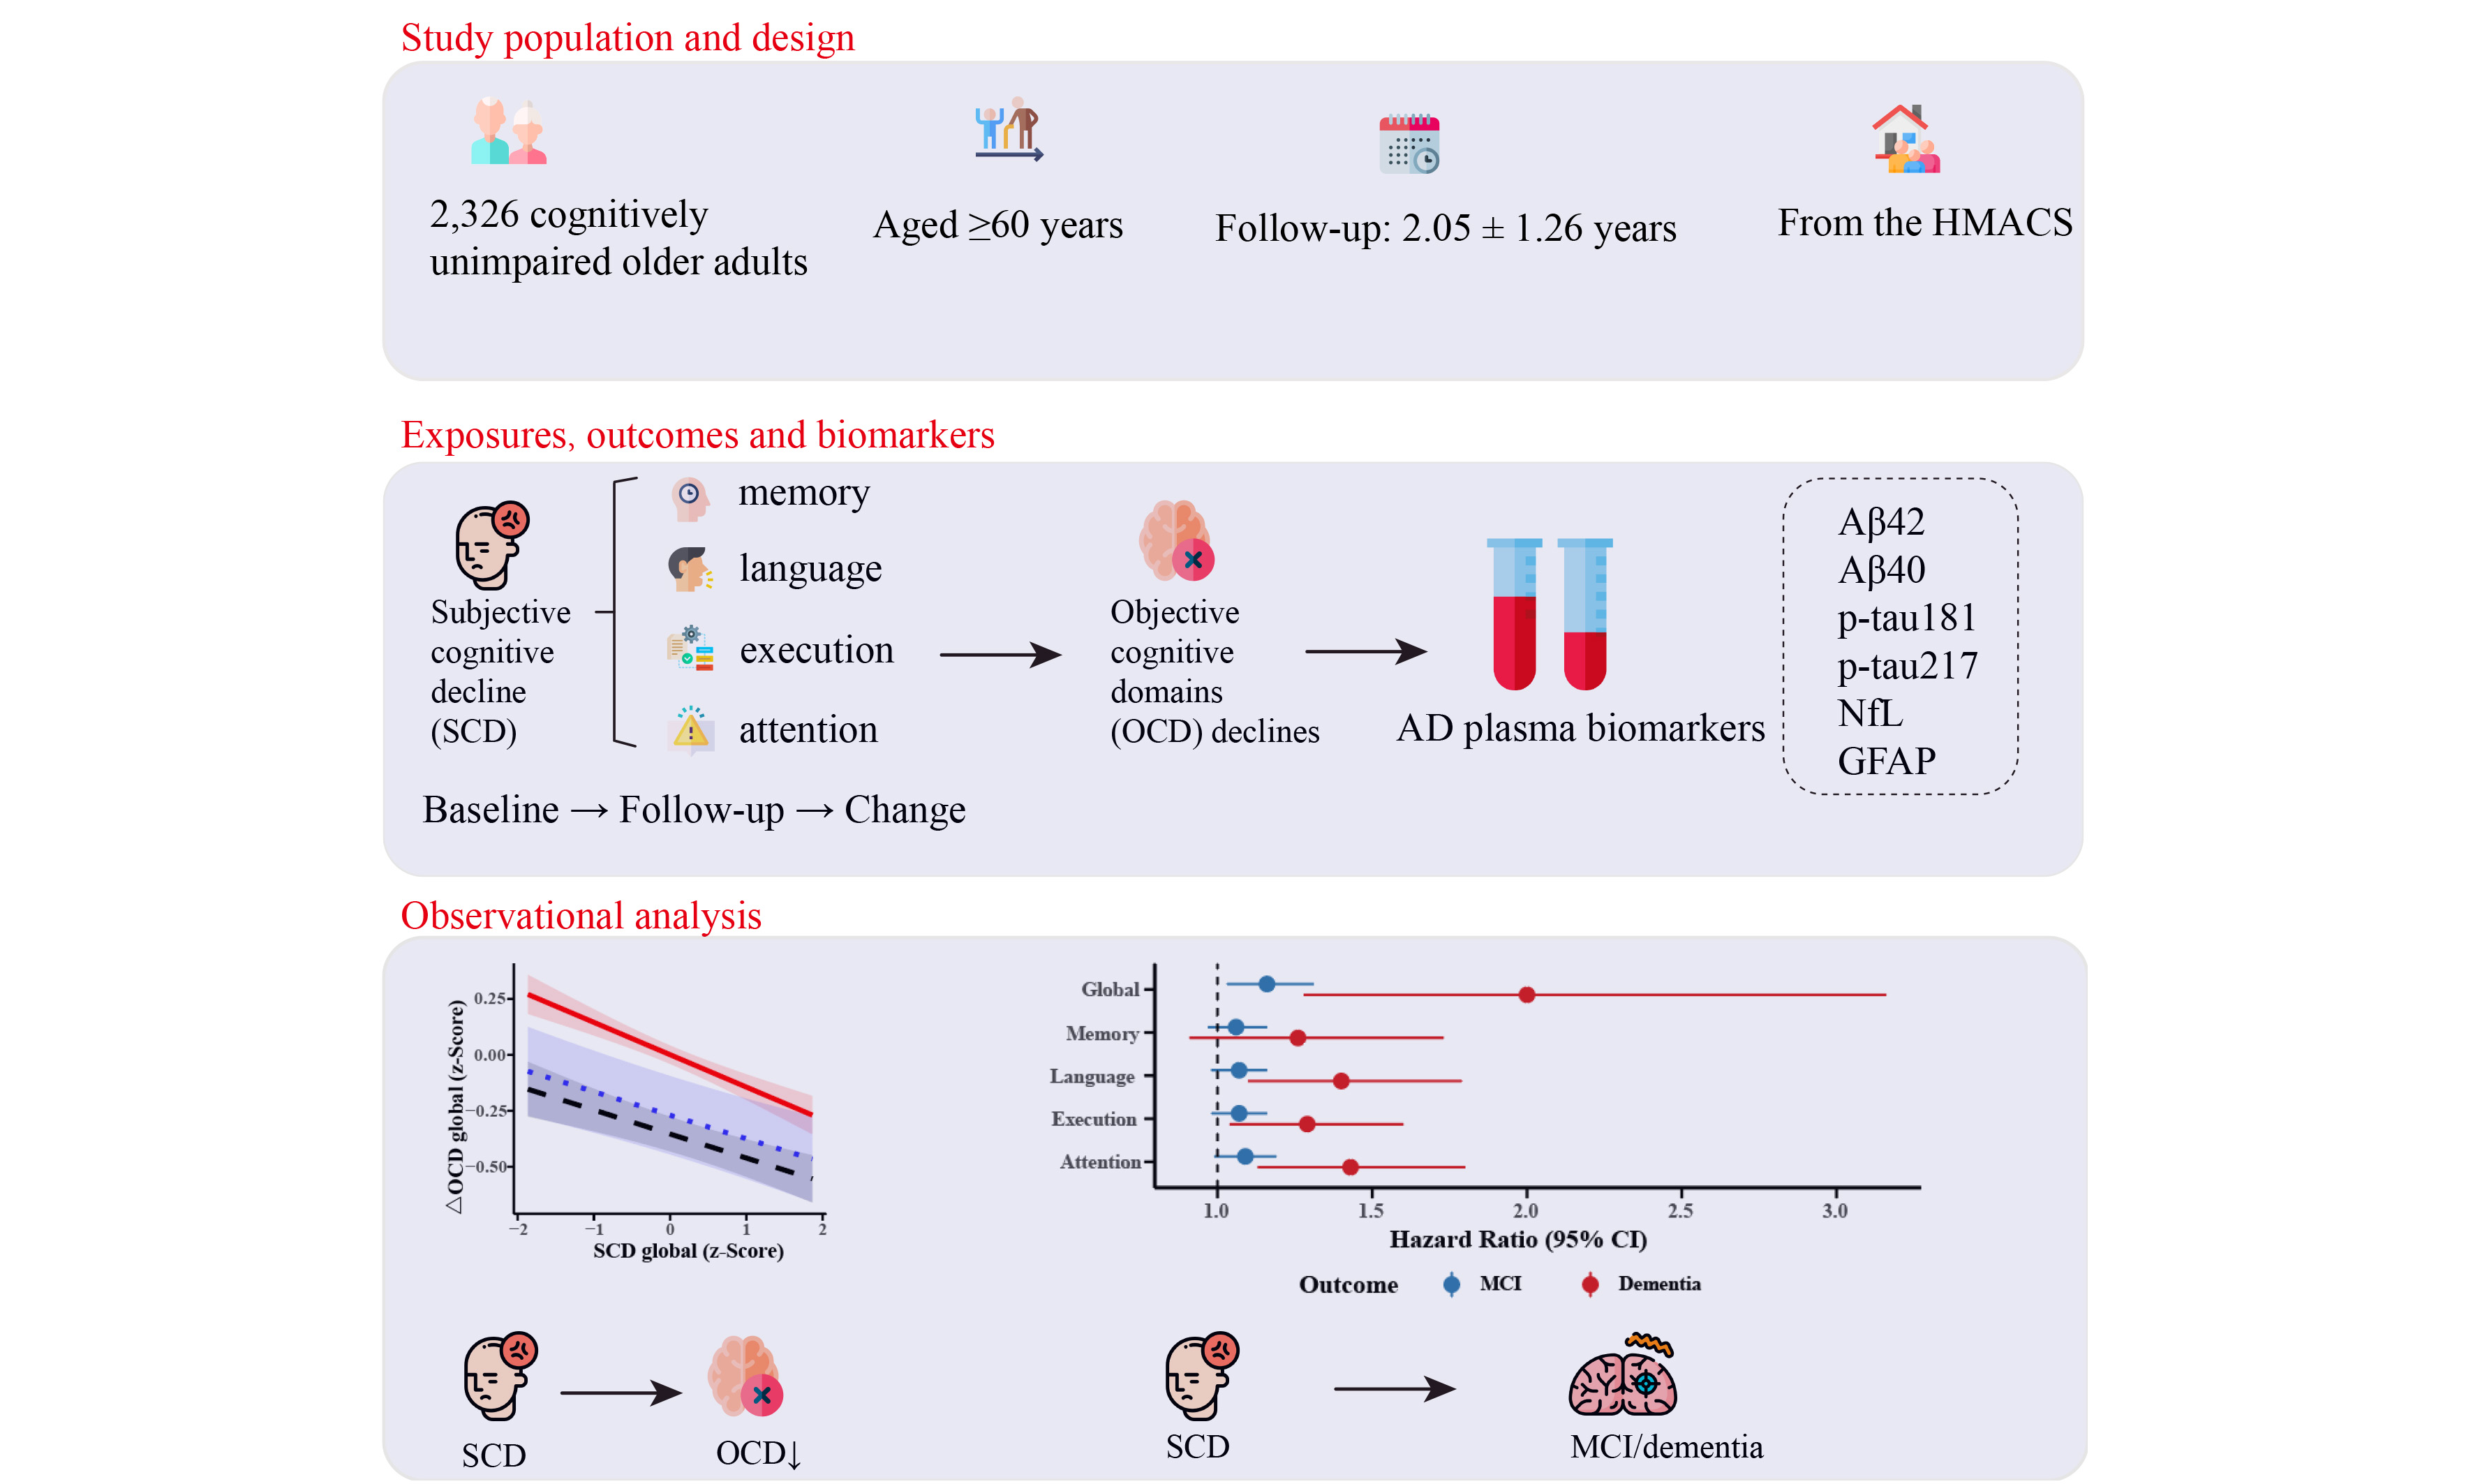
Methods: We studied 2,326 cognitively unimpaired adults (aged ≥ 60 years) from the Hubei Memory and Aging Cohort. SCD and objective cognition were assessed at baseline and follow-up. Changes were calculated using reliable change indices. Mild cognitive impairment (MCI) and dementia were clinically diagnosed. Baseline plasma biomarkers [Aβ42, Aβ40, p-tau181, p-tau217, (neurofilament light chain) NfL, (glial fibrillary acidic protein) GFAP] were measured using the Quanterix Simoa® platform.
Results: Longitudinal changes in domain-specific SCD (memory, language, execution, and attention) over 2.05 ± 1.26 years were associated with outcomes, including declines in global and subdomain objective cognition, and incident MCI and dementia. Specifically, follow-up SCD memory correlated with a decline in objective memory (β = -0.06, P = 0.025). SCD language, attention, and execution predicted increased MCI/dementia risk. Higher global SCD was associated with lower baseline Aβ42 (β = -0.10, P = 0.049) and Aβ40 (β = -0.13, P = 0.029).
Conclusion: Persistent domain-specific SCD progression is associated with greater cognitive decline and clinical impairment in cognitively unimpaired older adults, and correlates with plasma Aβ levels.
Keywords
INTRODUCTION
Global population aging is driving an increase in the prevalence of Alzheimer’s disease (AD) and other dementias[1]. AD accounts for approximately 60%-80% of dementia cases[2] and poses a critical public health threat. Current disease-modifying therapies demonstrate efficacy primarily in the mild cognitive impairment (MCI) and early dementia stages[3-5], underscoring the need to shift focus toward pre- or early clinical detection using cost-effective biomarkers[6]. Subjective cognitive decline (SCD) was formally defined in 2014[7] and operationalized as Stage 2 in the AD continuum according to the 2024 revised Alzheimer’s Association criteria[8]. Amyloid-positive SCD specifically marks this preclinical AD stage[9], and epidemiological studies confirm that SCD is associated with an elevated risk of progression to AD, approximately 10% every three years[10-13]. Neuroimaging studies further corroborate early pathology in SCD, including medial temporal atrophy[14,15] and hippocampal-parietal degeneration[16]. Moreover, the integrative (amyloid, tau, and neurodegeneration) ATN biomarker framework, incorporating plasma markers [amyloid-β (Aβ), p-tau181, (glial fibrillary acidic protein) GFAP, and (neurofilament light chain) NfL] and magnetic resonance imaging (MRI) indicators, has shown particular utility in predicting near-term cognitive decline[17].
Despite these advances, significant challenges remain. Commonly used SCD assessments, such as the Everyday Cognition (ECog) scale, disproportionately emphasize memory and executive functions while underrepresenting language and attention domains[18,19]. Although self-reported SCD correlates with objective memory and language deficits[20], its longitudinal association with declines in specific cognitive subdomains has not been firmly established. Furthermore, following the 2018 AD biomarker framework[21], the link between SCD and the AD continuum requires further strengthening. The DELCODE study linked minor objective cognitive deficits in SCD to lower cerebrospinal fluid (CSF) Aβ42 levels[22], and Aβ(1-38) has been shown to predict conversion from SCD to MCI[21]; however, classical plasma biomarker studies face inherent limitations. Small-sample studies suggest that GFAP and p-tau isoforms (p-tau181, p-tau217) can differentiate MCI from SCD[22-24]; nevertheless, the multimodal relationships remain fragmented. Critically, although evidence from the Alzheimer’s Disease Neuroimaging Initiative (ADNI) links ECog-assessed domains to amyloid-β positron emission tomography (Aβ-PET) and tau-PET[25], and other studies connect multidomain SCD to abnormal Aβ42/40 and p-tau[26], ECog subdomains demonstrate limited predictive utility for established biomarkers[27]. Consequently, a systematic investigation of persistent domain-specific SCD in relation to key plasma biomarkers, - namely Aβ42/40, p-tau181, p-tau217, GFAP, and NfL - has emerged as an essential research priority.
This community-based cohort study therefore addresses three pivotal questions: first, the associations between domain-specific SCD and declines in objective cognitive domains (OCD); second, the relationships between SCD and plasma AD biomarkers; and third, the associations of SCD with the incidence of MCI and dementia. Figure 1 shows the analytical strategy. The findings are expected to advance early AD detection paradigms.
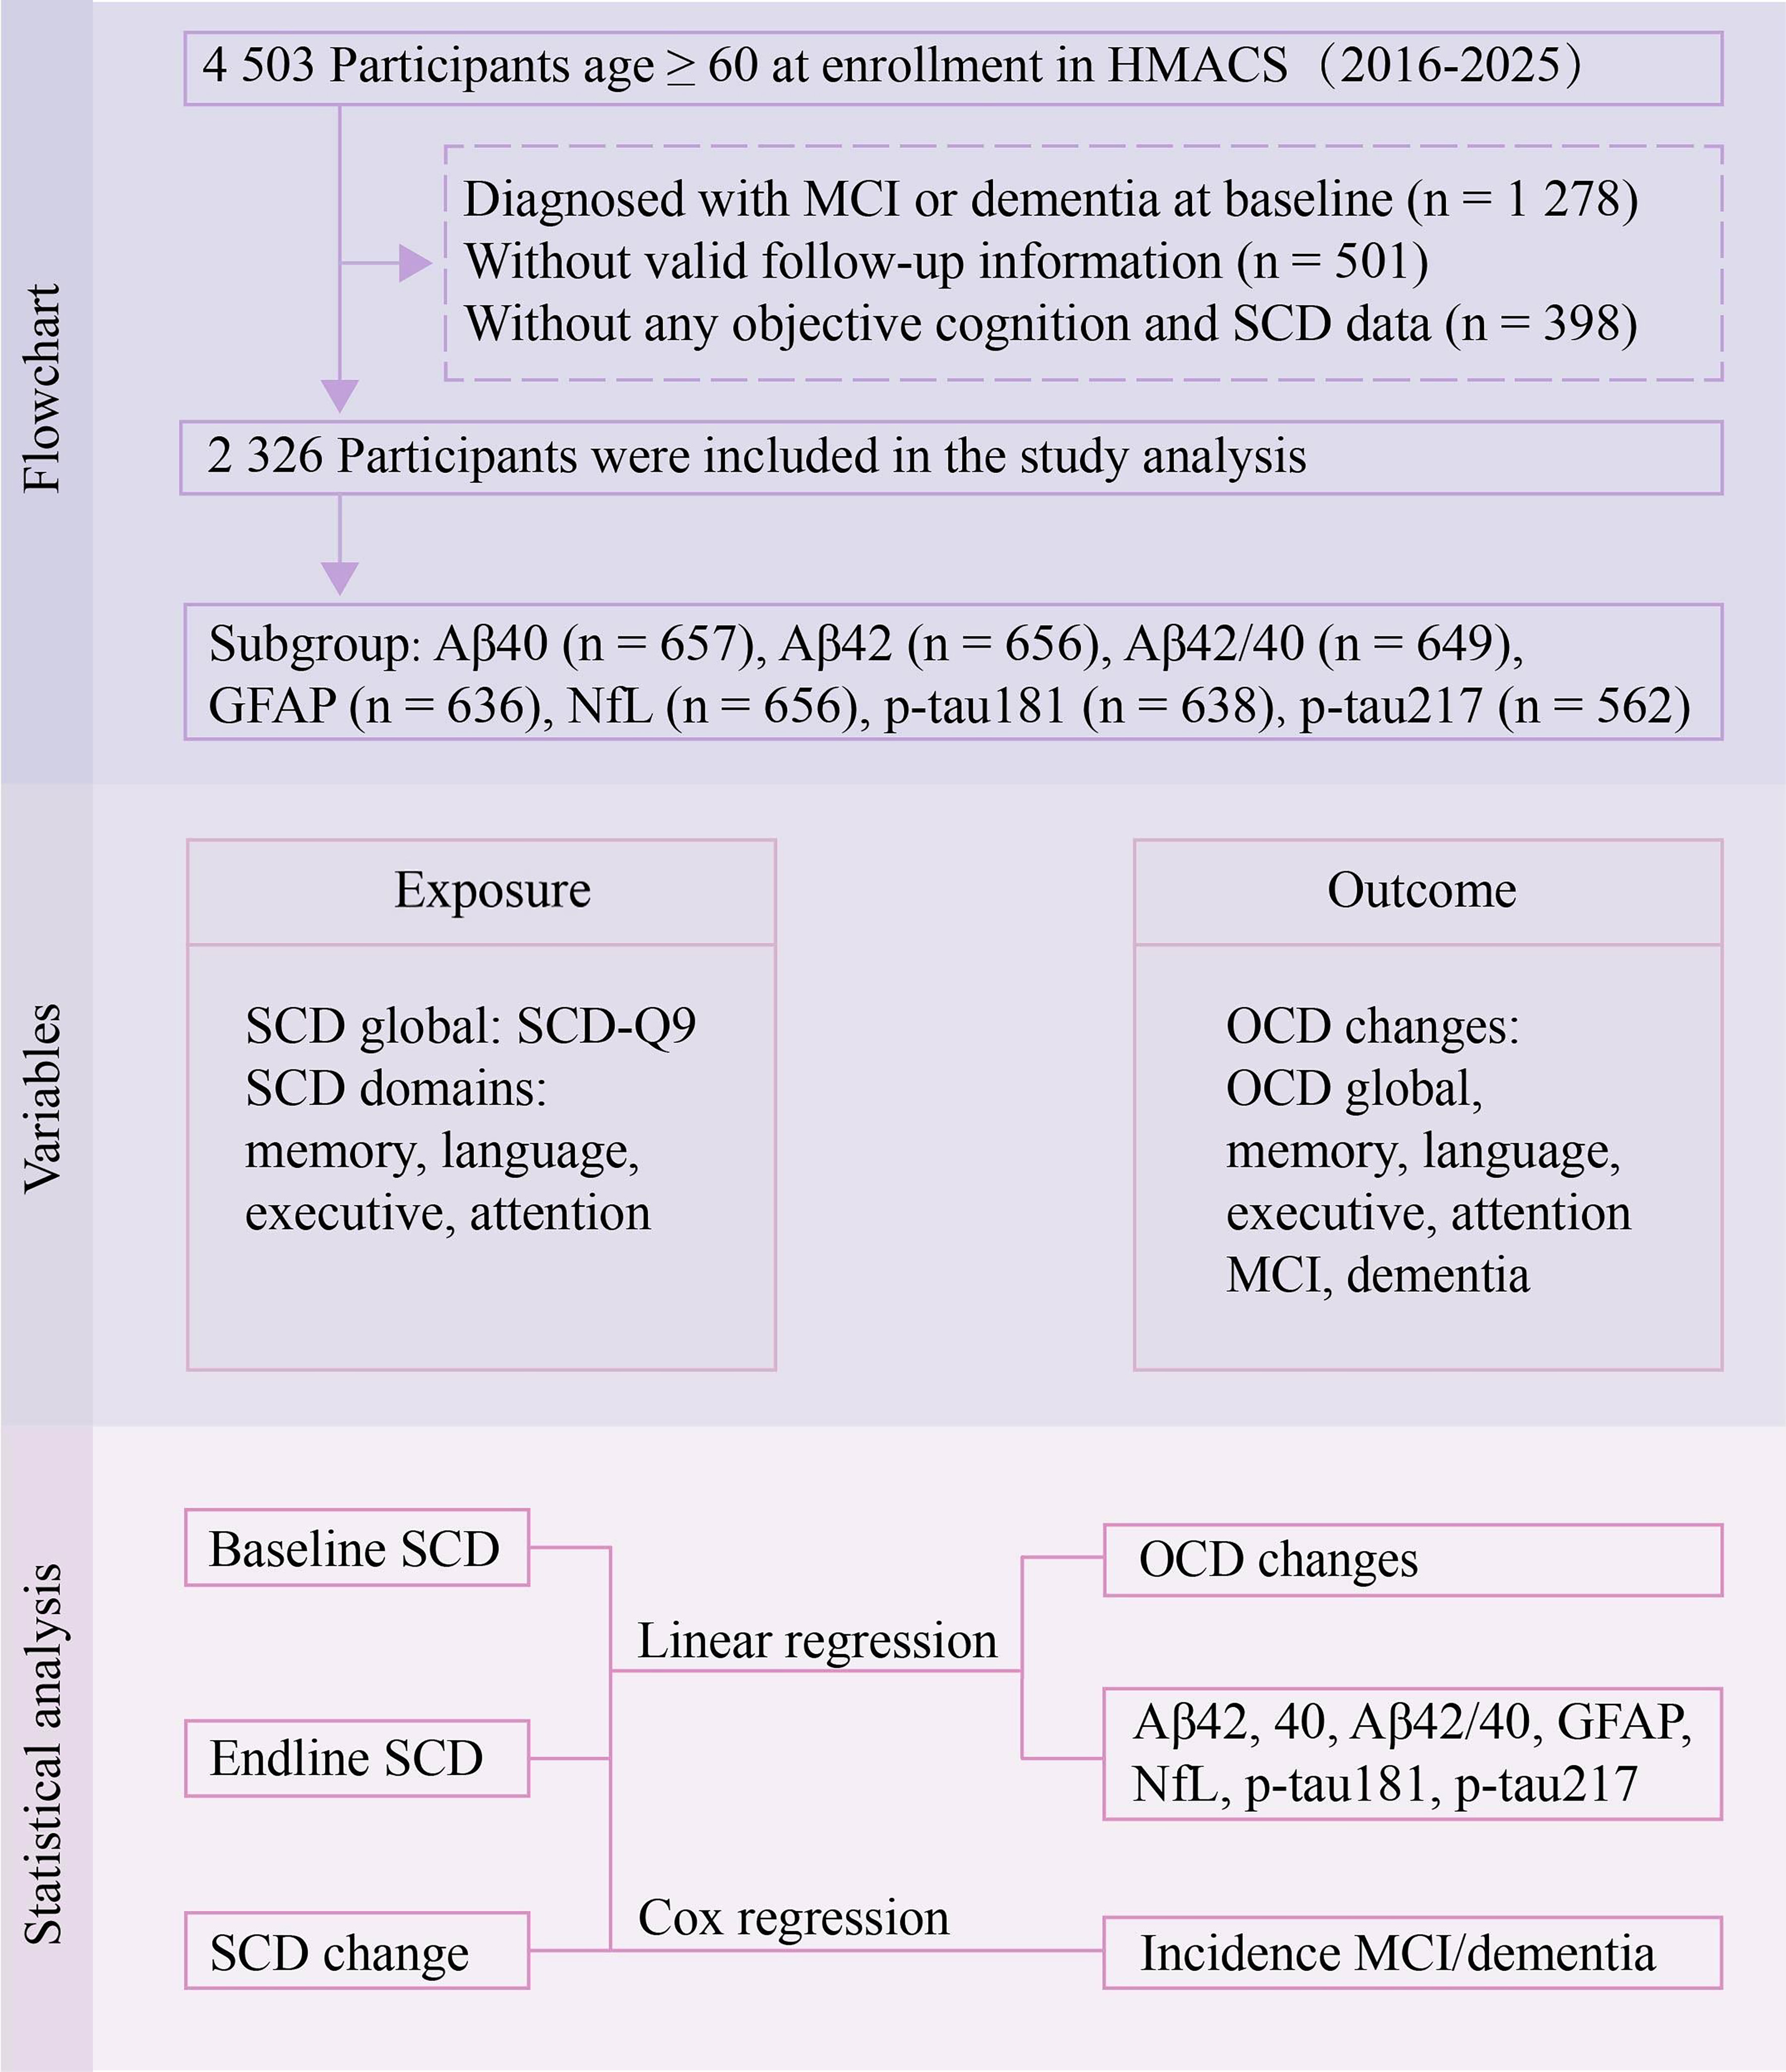
Figure 1. The study design flowchart. MCI: Mild cognitive impairment; SCD: subjective cognitive decline; OCD: objective cognitive domains; HMACS: Hubei Memory and Aging Cohort Study; NfL: neurofilament light chain; GFAP: glial fibrillary acidic protein.
METHODS
Study participants
Participants were from the Hubei Memory and Aging Cohort Study (HMACS; ChiCTR1800019164), an ongoing prospective community-based cohort in central China[20,28-30]. The cohort design and assessment protocols have been described in detail previously[31]. Initially, 4,503 individuals aged ≥ 60 years who completed baseline and at least one follow-up cognitive assessment, were conscious, and provided written informed consent were enrolled. We excluded participants with baseline MCI or dementia (n = 1,278), those lost to follow-up (n = 501), and those with missing key cognitive or SCD data (n = 398). The final analytical sample comprised 2,326 participants. The study received approval from the Medical Ethics Committee of Wuhan University of Science and Technology (Approval No.: 201845), and all participants provided written informed consent [Figure 1].
SCD assessment
SCD was assessed at baseline and follow-up using the SCD‑Q9 scale[20] and a domain-specific SCD scale. Three exclusion questions were applied to determine whether SCD could be attributed to psychiatric disorders (e.g., depression or anxiety), other medical conditions, or substance use. The SCD‑Q9 evaluates nine cognitive features: (1) memory decline for recent events; (2) difficulty recalling conversations from several days prior; (3) memory problems over the past two years; (4) memory worse than five years ago; (5) increasing forgetfulness of item locations; (6) difficulty remembering scheduled tasks; (7) frequency of forgetting important dates; (8) frequency of forgetting frequently used numbers; and (9) frequency of forgetting shopping intentions. Items 1-6 were scored binarily (yes = 1, no = 0), while items 7-9 were rated as often = 1, occasionally = 0.5, or never = 0. Total scores range from 0 to 9, with higher scores reflecting greater SCD severity.
SCD was defined according to the Subjective Cognitive Decline Initiative (SCD‑I) framework, requiring: (1) a total SCD‑Q9 score ≥ 5, indicating definite abnormality not attributable to other causes[32]; (2) objective cognitive performance within 1.5 standard deviations (SD) of age- and education-adjusted norms; and (3) concurrent fulfillment of both criteria. Individuals without clear cognitive impairment but lacking corroborative information for criteria (1) and (2) were classified as non-SCD.
The domain-specific SCD scale assessed five cognitive domains: everyday memory, language, executive function, attention, and visuospatial function. For each domain, participants rated changes across multiple timeframes (past 6 months, 12 months, 2 years, and 5 years), help-seeking behavior, and self-comparison with peers. Domain scores range from 0 to 6, with higher scores indicating greater severity; a separate worry dimension was also included.
Objective cognition assessment
Objective cognitive function was assessed at baseline and follow-up using a standardized neuropsychological battery[30], including: (1) Global cognition: Mini-Mental State Examination for individuals with ≤ 6 years of education, Montreal Cognitive Assessment Basic for > 6 years; (2) Cognitive subdomains: Auditory Verbal Learning Test for episodic memory; Boston Naming Test and Verbal Fluency Test for language; Shape Trails Test for executive function; Digit Span Test for attention. For domains with multiple tests, raw composite scores were averaged and converted to age- and education-adjusted z-scores based on baseline means and SD.
Changes in SCD and OCD were calculated using the regression-based reliable change index (RCI)[33]. Linear regression predicted follow-up scores (T2pred) from baseline scores (T1) and interval time: T2pred = b × T1 + c × Time + Constant. Standardized change (RB-RCI) was computed as (T2observed - T2pred)/RMSE (root mean square error). The visuospatial domain was excluded due to > 20% missing data; accordingly, only the memory, language, executive, and attention SCD domains were analyzed.
Non-cognitive assessments
Basic and Instrumental Activities of Daily Living (BADL/IADL) were assessed using a 20-item scale (Sidney Katz). Disability was defined as ≥ 23 points for individuals aged < 75 years and ≥ 25 for those aged ≥ 75 years. The 15-item Geriatric Depression Scale (GDS)[34] assessed depressive symptoms (scores: 0-4, normal; 5-8, mild; 9-11, moderate; 12-15, severe). The Pittsburgh Sleep Quality Index assessed sleep quality over the past month (global score, 0-21; > 5 indicating poor sleep quality).
Cognitive impairment diagnosis
A diagnostic team consisting of neurologists and neuropsychiatrists diagnosed MCI and dementia based on Petersen’s criteria[35] and the Diagnostic and Statistical Manual of Mental Disorders, Fourth Edition criteria[36], Detailed diagnostic criteria for MCI and dementia are provided in the supplementary materials. Normal cognition was defined as meeting all of the following criteria: (1) Clinical Dementia Rating = 0; (2) no functional impairment attributable to cognition; (3) neuropsychological performance within 1.5 SD of norms; and (4) no subjective cognitive complaints[37].
Blood AD biomarkers
A total of 657 samples had measures at baseline for plasma Aβ40 (n = 657), Aβ42 (n = 656), Aβ42/Aβ40 (n = 649), GFAP (n = 636), NfL (n = 656), p-tau181 (n = 638), and p-tau217 (n = 562). Fasting venous blood was collected in EDTA tubes, centrifuged at 2,000 × g within 2 hours, and plasma stored at -80 °C. Biomarkers were quantified using Simoa technology (Quanterix). Kits included: Simoa® Human pTau-181 Advantage V2 Kit (#103714), Simoa® ALZpath pTau-217 v2 Assay Kit (#104371), and SimoaTM Neurology 4-Plex E Advantage Kit (#103670).
Covariates
The study included 23 covariates that have been established to be associated with either the independent variables or the outcome variables. They included socio-demographics (age, sex, education, residence, marital status, living alone, stable income, income satisfaction, personality), lifestyle factors (smoking, drinking, physical/cognitive activities), social engagement (siblings, close friends, neighbor interaction), medical history (hypertension, diabetes, coronary heart disease, hyperlipidemia, cerebrovascular disease), insomnia, and depressive symptoms. These variable assessments have been described previously[31].
Statistical analysis
Baseline characteristics of the study participants were summarized and compared according to SCD status. Continuous variables are expressed as mean ± SD, while categorical variables are presented as numbers (percentages). Between-group differences were assessed using t-tests, analysis of variance (ANOVA), or Wilcoxon rank sum tests for continuous variables, as appropriate, and chi-squared tests for categorical variables. All cognitive scores were standardized to z-scores for analysis.
Generalized linear models were used to assess associations between each of the following SCD metrics (baseline SCD domains, follow-up SCD domains, and their changes over time) and changes in objective cognitive performance. In a subcohort, associations between these SCD metrics and plasma AD biomarkers were analyzed; the biomarkers were log-transformed to correct skewed distributions. Cox proportional hazards models were used to evaluate the associations between the SCD metrics and the risk of incident MCI or dementia. All analyses were adjusted for covariates in three steps: (1) unadjusted; (2) demographic-adjusted; (3) fully adjusted. Sensitivity analyses included repeating the above association analyses between SCD and OCD using linear mixed models and stratified by sex and age.
Missing data (0.1%-4.4%) were handled by multiple imputation using chained equations (five imputed datasets). Analyses were performed using R version 4.4.3. Two-sided P < 0.05 was considered statistically significant, with Bonferroni correction applied for multiple testing.
RESULTS
Participant characteristics
This study included 2,326 cognitively unimpaired community-dwelling adults from the HMACS (mean age 70.87 ± 5.06 years; 52.1% female, 44.4% rural residents, and 7.83 ± 5.11 years of education). At baseline, 1,398 individuals (60.1%) reported SCD. Compared with those without SCD, individuals with SCD included a higher proportion of females and urban residents, had lower education, a higher prevalence of insomnia, and higher scores on the GDS and levels of p-tau217. All between-group differences were statistically significant (P < 0.05) [Table 1]. Significant differences were also observed between the SCD and non-SCD groups in all z-scores for global and domain-specific subjective cognitive measures at baseline and follow-up end, as well as for global and domain-specific objective cognitive scores at both time points [Supplementary Table 1]. The mean follow-up duration was 2.05 ± 1.26 years. During the follow-up period, 530 participants developed MCI, and 57 developed dementia.
Participant characteristics by subjective cognitive decline complaints at baseline (n = 2,326)
| Variables | Total sample, (n = 2,326) | SCD (n = 1,398) | Non-SCD (n = 928) | χ2 /z/t | P value |
| Sex (female) | 1,213 (52.1) | 772 (55.2) | 441 (47.5) | 12.95 | < 0.001 |
| Age group (years) | |||||
| 60-69 | 1,067 (45.9) | 648 (46.4) | 419 (45.2) | 0.28 | 0.598 |
| ≥ 70 | 1,259 (54.1) | 750 (53.6) | 509 (54.8) | ||
| Education (years) | |||||
| ≤ 6 | 913 (39.3) | 624 (44.6) | 289 (31.1) | 43.46 | < 0.001 |
| 6-12 | 1,095 (47.1) | 607 (43.4) | 488 (52.6) | ||
| ≥ 12 | 318 (13.7) | 167 (11.9) | 151 (16.3) | ||
| Residence location (rural) | 1,033 (44.4) | 684 (48.9) | 349 (37.6) | 28.49 | < 0.001 |
| Married (yes) | 1,763 (75.8) | 1,040 (74.4) | 723 (77.9) | 3.57 | 0.059 |
| Personality | |||||
| Neutral | 853 (36.7) | 531 (38.0) | 322 (34.7) | 2.6 | 0.272 |
| Extroversion | 1,057 (45.4) | 623 (44.6) | 434 (46.8) | ||
| Introversion | 416 (17.9) | 244 (17.5) | 172 (18.5) | ||
| No living siblings (yes) | 704 (30.3) | 524 (37.5) | 180 (19.4) | 85.58 | < 0.001 |
| Number of close friends | |||||
| None | 689 (27.0) | 481 (30.0) | 208 (21.9) | 29.919 | < 0.001 |
| 1-2 | 474 (18.6) | 313 (19.5) | 161 (16.9) | ||
| 3-5 | 736 (28.8) | 436 (27.2) | 300 (31.6) | ||
| ≥ 6 | 654 (25.6) | 373 (23.3) | 281 (29.6) | ||
| Living alone (yes) | 376 (16.2) | 255 (18.2) | 121 (13.0) | 10.75 | 0.001 |
| Stable income (yes) | 1,990 (85.6) | 1,171 (83.8) | 819 (88.3) | 8.75 | 0.003 |
| Satisfied with income (yes) | 1,462 (62.9) | 820 (58.7) | 642 (69.2) | 26.19 | < 0.001 |
| Interactions with neighbors | |||||
| Rarely | 498 (21.4) | 304 (21.7) | 194 (20.9) | 0.74 | 0.864 |
| A couple of times per year | 583 (25.1) | 342 (24.5) | 241 (26.0) | ||
| A couple of times per week | 559 (24.0) | 337 (24.1) | 222 (23.9) | ||
| Almost every day | 686 (29.5) | 415 (29.7) | 271 (29.2) | ||
| Smoking (yes) | 706 (30.4) | 417 (29.8) | 289 (31.1) | 0.4 | 0.529 |
| Drinking (yes) | 706 (30.4) | 417 (29.8) | 289 (31.1) | 0.4 | 0.529 |
| Physical activities (yes) | 1,721 (74.0) | 1,001 (71.6) | 720 (77.6) | 10.07 | 0.002 |
| Intellectual activities (yes) | 1,325 (57.0) | 770 (55.1) | 555 (59.8) | 4.89 | 0.027 |
| Hypertension (yes) | 1,287 (55.3) | 776 (55.5) | 511 (55.1) | 0.03 | 0.867 |
| Diabetes (yes) | 440 (18.9) | 268 (19.2) | 172 (18.5) | 0.11 | 0.742 |
| Hyperlipidemia (yes) | 627 (27.0) | 398 (28.5) | 229 (24.7) | 3.88 | 0.049 |
| Coronary disease (yes) | 417 (17.9) | 265 (19.0) | 152 (16.4) | 2.34 | 0.126 |
| Cerebrovascular disease (yes) | 472 (20.3) | 326 (23.3) | 146 (15.7) | 19.38 | < 0.001 |
| Insomnia (yes) | 1,210 (52.0) | 798 (57.1) | 412 (44.4) | 35.45 | < 0.001 |
| Age (years) | 70.87 (5.06) | 70.86 (5.05) | 70.88 (5.07) | 0.980 | 0.922 |
| Education (years) | 7.83 (5.11) | 7.23 (5.18) | 8.73 (4.86) | 7.07 | < 0.001 |
| GDS | 1.24 (1.56) | 1.46 (1.71) | 0.92 (1.22) | -8.88 | < 0.001 |
| Plasma biomarker | |||||
| Aβ40 | 58.71 (40.86) | 58.57 (39.78) | 58.86 (42.06) | 0.09 | 0.927 |
| Aβ42 | 3.76 (2.66) | 3.76 (2.71) | 3.76 (2.60) | -0.02 | 0.982 |
| Aβ42/40 | 0.10 (0.28) | 0.09 (0.19) | 0.10 (0.36) | 0.46 | 0.635 |
| NfL | 128.05 (76.49) | 125.76 (80.68) | 130.56 (71.63) | 0.16 | 0.420 |
| GFAP | 24.71 (15.43) | 24.62 (13.80) | 24.81 (17.06) | 0.81 | 0.873 |
| p-tau217 | 0.19 (0.16) | 0.21 (0.18) | 0.17 (0.14) | -2.29 | 0.023 |
| p-tau181 | 2.11 (1.21) | 2.19 (1.24) | 2.02 (1.17) | -1.79 | 0.075 |
Association of SCD (baseline, endpoint, and changes during follow-up) with changes in OCD
We first examined the association between baseline domain-specific SCD and changes in OCD. No significant associations were observed between any baseline SCD domains and changes in their corresponding OCD (all P > 0.05) [Supplementary Table 2]. Next, we analyzed the association between SCD domains at the end of follow-up and changes in OCD. After adjustment for all covariates, a higher global SCD score was associated with a decline in global OCD (β = -0.10, P < 0.001). Specifically, a higher SCD memory score was associated with a decline in OCD memory (β = -0.06, P = 0.025), and a higher global SCD score was associated with declines in OCD memory (β = -0.08, P = 0.008) and attention (β = -0.08, P = 0.002). In addition, a higher SCD execution score was associated with a decline in global OCD (β = -0.09, P < 0.001; Figure 2 and Supplementary Table 3). Finally, we investigated the association between changes in SCD domains and OCD. An increase in global SCD score was significantly associated with a decline in global OCD (β = -0.08, P = 0.001). Increases in SCD language (β = -0.08, P = 0.001) and execution scores (β = -0.07, P = 0.001) were each associated with a decline in global OCD. Moreover, an increase in global SCD score was associated with a decline in OCD attention (β = -0.07, P = 0.010) [Figure 2 and Supplementary Table 4].
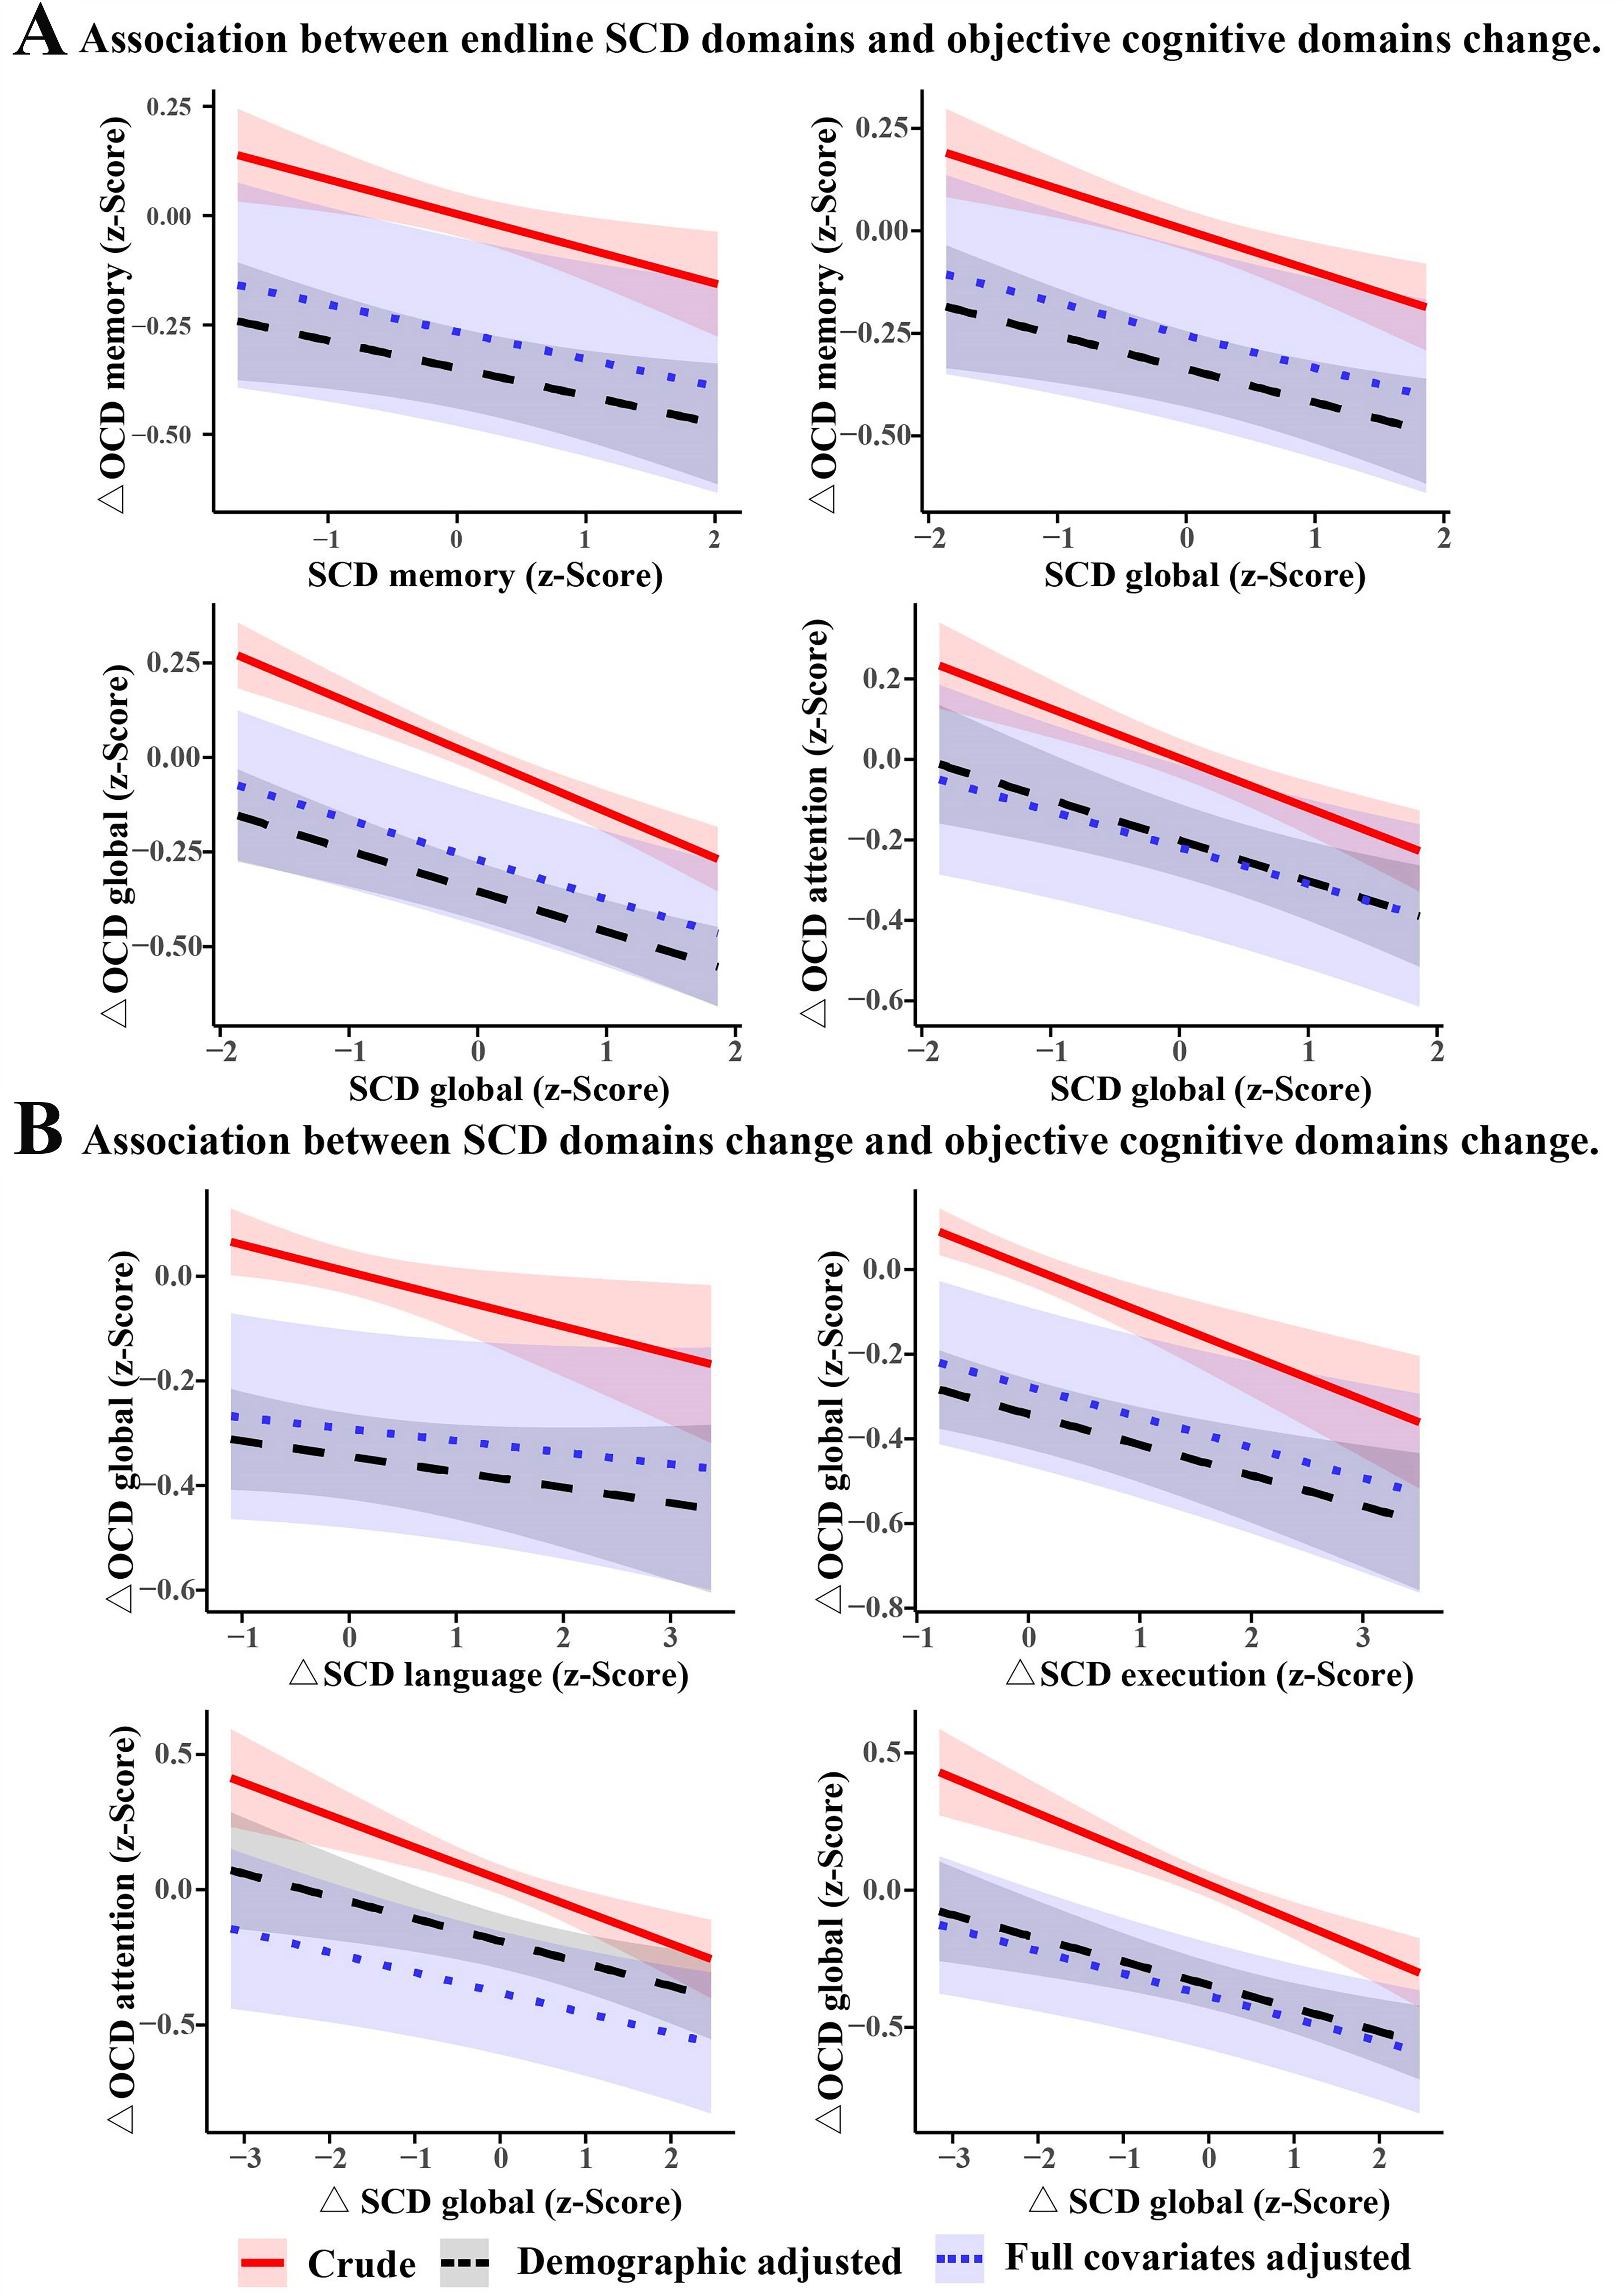
Figure 2. Association of endline SCD domains and their two-year change with changes in objective cognitive domains. Average marginal mean estimates for objective cognitive domains change (and their 95%CIs) as a function of SCD domains. Demographic adjustment includes age, sex, education, and residence location. Full covariate adjustment additionally accounts for social network, lifestyle, and comorbidities, that is, all 23 variables which are listed in Table 1. SCD: Subjective cognitive decline; OCD: objective cognitive domains; CI: confidence interval.
Association between SCD domains and incident MCI/dementia
After full covariate adjustment, a higher global SCD score at the end of follow-up was associated with an increased risk of both MCI (HR = 1.17, P = 0.043) and dementia (HR = 1.75, P = 0.009). Similarly, SCD language was associated with dementia risk (HR = 1.44, P = 0.005), while SCD execution was associated with both MCI (HR = 1.10, P = 0.038) and dementia (HR = 1.33, P = 0.017). SCD attention was also associated with MCI (HR = 1.11, P = 0.020) and dementia (HR = 1.49, P = 0.001). In addition, an increase in global SCD over time was associated with incident MCI (HR = 1.16, P = 0.017). Increases in SCD global (HR = 2.00, P = 0.002), language (HR = 1.40, P = 0.006), execution (HR = 1.29, P = 0.018), and attention (HR = 1.43, P = 0.003) were all significantly associated with the risk of incident dementia [Figure 3 and Supplementary Tables 5-7].
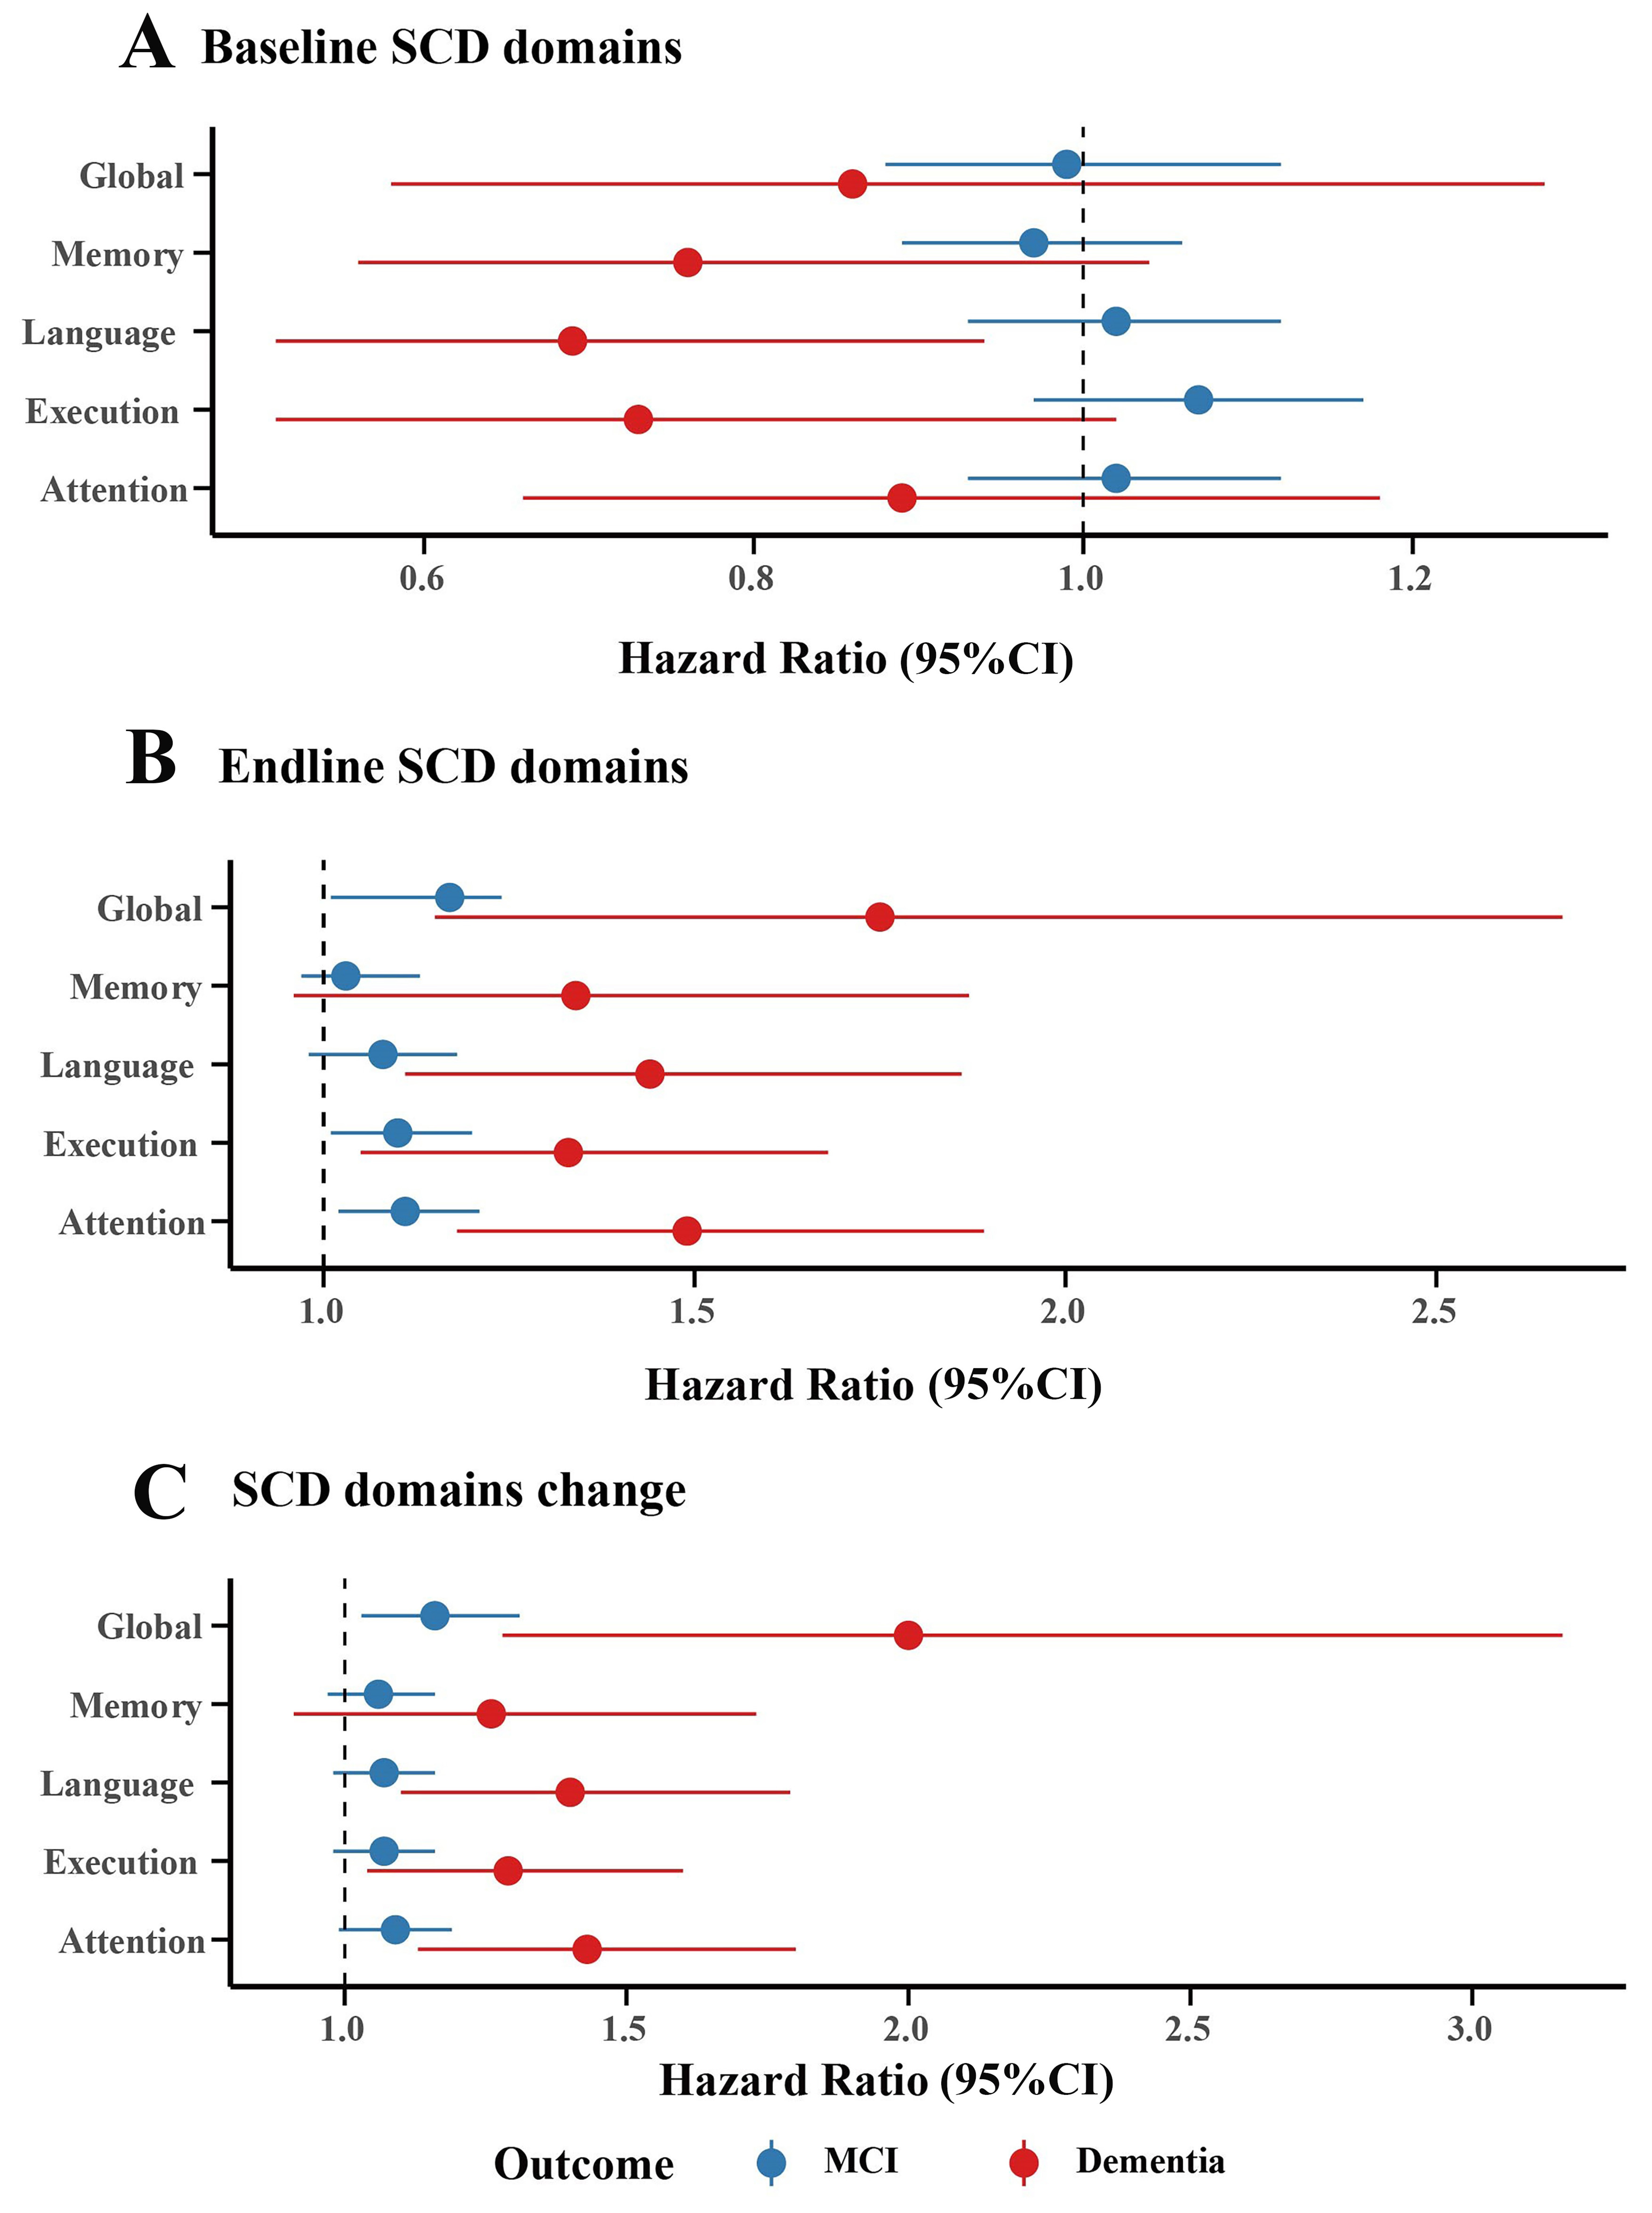
Figure 3. Association of baseline, endline, and change over two years of SCD domains with incident MCI and dementia. Fully adjusted for covariates (adjusted variables: sex, age, education, residence, marriage, stable income, satisfaction with income, living alone, number of living siblings, number of close friends, frequency of interacting with neighbors, personality, smoking, drinking, physical activities, intellectual activities, hypertension, diabetes, coronary heart disease, hyperlipidemia, cerebrovascular disease, insomnia, and GDS). SCD: Subjective cognitive decline; CI: confidence interval; MCI: mild cognitive impairment; GDS: geriatric depression scale.
Association between SCD and plasma AD biomarkers
In the AD biomarker sub-cohort (n = 657), no significant associations were observed at baseline between domain-specific SCD scores and plasma biomarkers after full covariate adjustment [Table 2]. However, longitudinal analyses showed that a higher global SCD score at the end of follow-up was significantly associated with lower Aβ42 (β = -0.10, P = 0.049) and Aβ40 (β = -0.13, P = 0.029) [Table 3]. Furthermore, an increase in global SCD score was correlated with lower p-tau181 (β = -0.05, P = 0.047) [Table 4].
The association between baseline SCD domains and plasma AD biomarkers
| Plasma biomarker | SCD-Global β (95%CI) | P value | SCD-Memory β (95%CI) | P value | SCD-Language β (95%CI) | P value | SCD-Execution β (95%CI) | P value | SCD-Attention β (95%CI) | P value |
| Aβ42 | -0.07 (-0.18, 0.03) | 0.188 | -0.04 (-0.13, 0.04) | 0.346 | -0.03 (-0.12, 0.06) | 0.496 | -0.05 (-0.15, 0.04) | 0.280 | -0.05 (-0.13, 0.04) | 0.817 |
| Aβ40 | -0.07 (-0.20, 0.06) | 0.306 | -0.03 (-0.14, 0.08) | 0.586 | -0.03 (-0.14, 0.09) | 0.648 | -0.04 (-0.16, 0.08) | 0.508 | -0.07 (-0.17, 0.04) | 0.682 |
| Aβ42/40 | 0.03 (-0.01, 0.08) | 0.176 | 0.02 (-0.03, 0.06) | 0.473 | 0.02 (-0.06, 0.03) | 0.449 | 0.02 (-0.02, 0.07) | 0.309 | 0.01 (-0.03, 0.05) | 0.052 |
| NfL | -0.01 (-0.05, 0.03) | 0.612 | -0.02 (-0.05, 0.02) | 0.390 | -0.01 (-0.05, 0.02) | 0.456 | -0.00 (-0.04, 0.03) | 0.805 | -0.00 (-0.04, 0.03) | 0.360 |
| GFAP | -0.02 (-0.07, 0.03) | 0.420 | -0.00 (-0.05, 0.04) | 0.879 | 0.01 (-0.03, 0.06) | 0.575 | 0.00 (-0.05, 0.05) | 0.949 | -0.01 (-0.05, 0.03) | 0.390 |
| p-tau217 | -0.02 (-0.11, 0.07) | 0.648 | -0.04 (-0.12, 0.04) | 0.309 | 0.01 (-0.07, 0.09) | 0.833 | -0.01 (-0.10, 0.07) | 0.749 | -0.03 (-0.10, 0.05) | 0.489 |
| p-tau181 | 0.02 (-0.03, 0.08) | 0.409 | -0.01 (-0.06, 0.03) | 0.542 | 0.03 (-0.02, 0.07) | 0.271 | 0.03 (-0.02, 0.08) | 0.284 | -0.00 (-0.05, 0.04) | 0.998 |
The association between endline SCD domains and plasma AD biomarkers
| Plasma biomarker | SCD-Global β (95% CI) | P value | SCD-Memory β (95%CI) | P value | SCD-Language β (95%CI) | P value | SCD-Execution β (95%CI) | P value | SCD-Attention β (95%CI) | P value |
| Aβ42 | -0.10 (-0.19, -0.00) | 0.049 | -0.02 (-0.11, 0.06) | 0.614 | -0.00 (-0.09, 0.09) | 0.967 | -0.01 (-0.11, 0.08) | 0.789 | -0.01 (-0.10, 0.08) | 0.470 |
| Aβ40 | -0.13 (-0.25, -0.01) | 0.029 | 0.00 (-0.11, 0.11) | 0.959 | 0.02 (-0.10, 0.13) | 0.775 | -0.03 (-0.15, 0.09) | 0.604 | -0.05 (-0.16, 0.06) | 0.632 |
| Aβ42/40 | 0.01 (-0.03, 0.06) | 0.557 | 0.00 (-0.04, 0.05) | 0.862 | -0.00 (-0.05, 0.04) | 0.837 | -0.00 (0.05, 0.04) | 0.925 | 0.02 (-0.02, 0.06) | 0.796 |
| NfL | 0.01 (-0.03, 0.05) | 0.503 | -0.00 (-0.04, 0.03) | 0.801 | 0.01 (-0.03, 0.04) | 0.721 | 0.03 (-0.01, 0.07) | 0.156 | 0.02 (-0.02, 0.05) | 0.421 |
| GFAP | 0.01 (-0.04, 0.06) | 0.715 | -0.03 (-0.08, 0.01) | 0.177 | 0.02 (-0.02, 0.07) | 0.315 | 0.01 (-0.04, 0.06) | 0.610 | 0.01 (-0.04, 0.05) | 0.574 |
| p-tau217 | -0.01 (-0.10, 0.07) | 0.742 | 0.00 (-0.08, 0.08) | 0.923 | -0.01 (-0.09, 0.07) | 0.729 | 0.01 (-0.08, 0.10) | 0.805 | -0.04 (-0.12, 0.04) | 0.552 |
| p-tau181 | -0.03 (-0.08 0.02) | 0.322 | -0.04 (-0.09, 0.01) | 0.089 | 0.02 (-0.03, 0.06) | 0.491 | 0.01 (-0.04, 0.07) | 0.575 | 0.00 (-0.05, 0.05) | 0.061 |
The association between SCD domains change and plasma AD biomarkers
| Plasma biomarker | △ SCD-Global β (95%CI) | P value | △ SCD-Memory β (95%CI) | P value | △ SCD-Language β (95%CI) | P value | △ SCD-Execution β (95%CI) | P value | △ SCD-Attention β (95%CI) | P value | |
| Aβ42 | -0.05 (-0.15, 0.05) | 0.308 | -0.04 (-0.13, 0.05) | 0.365 | 0.00 (-0.08, 0.09) | 0.950 | -0.01 (-0.10, 0.07) | 0.756 | 0.01 (-0.07, 0.09) | 0.470 | |
| Aβ40 | -0.12 (-0.24, 0.00) | 0.059 | -0.02 (-0.13, 0.09) | 0.757 | 0.02 (-0.09, 0.12) | 0.776 | -0.02 (-0.13, 0.09) | 0.677 | -0.02 (-0.13, 0.08) | 0.632 | |
| Aβ42/40 | 0.01 (-0.03, 0.06) | 0.598 | 0.00 (-0.04, 0.04) | 0.887 | 0.00 (-0.04, 0.04) | 0.957 | -0.01 (-0.05, 0.03) | 0.576 | 0.01 (-0.03, 0.05) | 0.796 | |
| NfL | 0.02 (-0.02, 0.06) | 0.241 | -0.00 (-0.04, 0.03) | 0.873 | 0.01 (-0.03, 0.04) | 0.676 | -0.03 (-0.01, 0.07) | 0.098 | 0.01 (-0.02, 0.05) | 0.421 | |
| GFAP | 0.04 (-0.01, 0.09) | 0.133 | -0.02 (-0.07, 0.02) | 0.275 | 0.02 (-0.02, 0.06) | 0.311 | 0.02 (-0.03, 0.06) | 0.454 | 0.00 (-0.04, 0.05) | 0.574 | |
| p-tau217 | -0.04 (-0.13, 0.05) | 0.357 | 0.00 (-0.08, 0.08) | 0.931 | -0.01 (-0.08, 0.06) | 0.734 | -0.00 (-0.08, 0.07) | 0.916 | -0.03 (-0.10, 0.05) | 0.552 | |
| p-tau181 | -0.05 (-0.11, -0.00) | 0.047 | -0.04 (-0.08, 0.01) | 0.127 | 0.01 (-0.03, 0.06) | 0.631 | 0.01(-0.04, 0.06) | 0.713 | 0.01 (-0.03, 0.06) | 0.061 | |
Sensitivity analyses
In sensitivity analyses stratified by age, no significant associations were observed between baseline SCD and changes in OCD in either age group. However, both higher global SCD at follow-up and increases in its score were associated with declines in global OCD, with domain-specific patterns differing by age: among participants aged 60-69, associations were observed in language and execution domains, while in those aged 70 or older, associations were found in memory and language domains. [Supplementary Tables 8-10].
Sex-stratified analyses revealed that in males, higher global SCD and execution scores at the end of follow-up were associated with declines in global OCD. In females, higher scores of SCD global, language, and attention were associated with declines in global OCD. An increase in global SCD score was also associated with declines in OCD global and attention [Supplementary Tables 11-13].
Linear mixed-effects models further confirmed the robustness of these findings. Significant interaction effects between global SCD score and time were observed for OCD global, memory, execution, and attention (P < 0.05) [Supplementary Table 14].
Correlations among the four subdomains were moderate (ranging from 0.26 to 0.62). VIF values were all below 2 (baseline: 1.44-1.57; endline: 1.64-1.93), well below the conventional threshold of 5, confirming that multicollinearity did not adversely affect our regression models [Supplementary Tables 15 and 16]. Among the 2,326 participants, 865 (37.2%) showed reliable worsening in at least one SCD domain. Notably, 132 participants (5.7%) exhibited worsening in only one domain, with executive function being the most frequent (n = 57, 2.5%), followed by language (n = 39, 1.7%), attention (n = 30, 1.3%), and memory (n = 6, 0.3%). Worsening in two or more domains was observed in 120 participants (5.1%) [Supplementary Table 17].
DISCUSSION
This community-based cohort study provides the first evidence that domain-specific SCD (in memory, language, execution, and attention) among cognitively unimpaired older adults, measured at follow-up or as change over 2.05 ± 1.26 years, was associated with decline in objective cognitive domains and with the incidence of MCI and dementia. These findings indicate that domain-specific SCD not only coincides with objective decline but also predicts near-term clinical onset. Furthermore, higher global SCD at follow-up was correlated with lower baseline plasma levels of Aβ42 and Aβ40, suggesting that plasma biomarkers may reflect both the presence and progression of SCD. Nevertheless, the stage and domain-specific characteristics of these biomarkers require further validation in larger longitudinal studies. Collectively, our results establish the value of SCD for screening AD-related cognitive impairment risk in community settings by linking domain-specific SCD to objective cognitive decline, clinical progression, and relevant plasma AD biomarkers.
A key advance of this study lies in its systematic assessment of four SCD subdomains (memory, language, executive function, and attention), along with behavioral characteristics such as time of onset, help-seeking behavior, and self-comparison with peers. This approach distinguishes it from prior studies that relied primarily on memory complaints alone[38,39]. We found that both SCD scores at the end of follow-up and their changes over approximately two years were significantly associated with objective cognitive decline. This finding extends previous work, including the Latino Neurocognitive Aging Study, which assessed only global SCD and memory/executive domains[6], and the DELCODE study, which linked global SCD to subtle cognitive deficits in a small sample[40]. Longitudinal changes in SCD may better capture the true trajectory of cognitive decline than single-time assessments, offering a more sensitive marker for early risk detection. Our results complement neuroimaging evidence showing that hippocampal and amygdala volumes predict five-year dementia risk in individuals with SCD or MCI[41]. The clinical relevance of our results is underscored by our cohort’s mean age (70.87 ± 5.06 years), which is closer to the high-risk period than that of the SOLINCA study (56.4 ± 8.1 years). Together with evidence linking SCD to atherosclerosis, AD neuropathological change (ADNC), Lewy body disease (LBD)[42], and neuroimaging biomarkers, our study reinforces SCD as a predictive target for dementia across the aging spectrum.
This study provides the first evidence that domain-specific SCD, particularly in non-memory domains such as language, executive function, and attention, is associated with the risk of MCI/dementia, whether measured at follow-up or as a change over time. This finding reinforces the view of SCD as the earliest symptomatic stage of AD[10,11,16]. Given that both the DSM-5 and the MCI classifications recognize single-domain impairment[43], tracking domain-specific changes in SCD has direct clinical relevance. Furthermore, the global burden of dementia largely stems from the combined effects of multiple co-occurring neuropathologies[44]. The inherent heterogeneity of AD dementia is evidenced by distinct pathology-cognition relationships, such as the association of medial temporal tau with memory deficits versus neocortical tau with executive dysfunction[45]. Co-occurrence of ADNC with limbic-predominant age-related TDP-43 encephalopathy neuropathologic change (LATE-NC), LBD, or cerebrovascular disease exacerbates global and domain-specific cognitive decline[44], and interactions among these pathologies shape distinct cognitive trajectories[46]. Against this complex and heterogeneous background, our study systematically links subjective and objective domain-specific decline, addressing a key gap in the current understanding of preclinical cognitive impairment.
We found that in this cognitively unimpaired cohort, a higher global SCD score at follow-up was associated with lower levels of Aβ42 and Aβ40, which is consistent with the results of another Sino-German study
Stratified analyses revealed notable sex- and age-related patterns that inform the clinical utility of SCD. The observed sex differences - specifically, women showed associations across global SCD, language, and attention domains, whereas men primarily exhibited associations in the executive domain - may reflect women’s greater health awareness and sensitivity to subtle cognitive fluctuations[52,53], whereas men’s executive complaints could align with vascular risk factors more prevalent in men that impact frontal-executive functions[45]. Age stratification further illuminated the evolving nature of SCD: in the younger subgroup (60-69 years), associations were strongest for language and executive domains, higher-order functions vulnerable to early AD pathology in prefrontal and parietal networks[10,16,45], whereas in participants aged ≥ 70 years, memory complaints emerged as the dominant predictor of objective memory decline, consistent with the classic progression of AD pathology to hippocampal structures[7]. This age-dependent shift from non-memory to memory complaints suggests that the predictive value of specific SCD domains evolves along the disease continuum, with implications for the timing and targeting of screening efforts.
The identification of 5.7% of participants exhibiting single-domain worsening provides direct evidence that SCD progression is not merely a reflection of scale properties but rather reflects genuine domain-specific neurobiological processes. The relatively low proportion of single-domain worsening may explain the modest effect sizes observed in group-level analyses, as most participants either remained stable or showed decline across multiple domains.
The key strengths of this study include the application of a multidimensional SCD-I- recommended framework, the novel examination of correspondences between domain-specific SCD and both plasma biomarkers and objective cognitive change, and a large sample size that enhances the reliability of the findings. Its limitations include a relatively short follow-up period, which hinders causal inference; the potential subjectivity inherent in self-reported questionnaires; the need for nationwide multi-center validation to ensure generalizability, the absence of an MCI or dementia comparator group to contextualize the magnitude of biomarker associations; and the lack of neuroimaging validation for the blood-based biomarkers.
In conclusion, this study demonstrates that domain-specific SCD scores are associated with objective cognitive decline over a mean follow-up of two years and that they indicate an increased risk of incident cognitive impairment. Women appear more sensitive to SCD. Plasma Aβ42 and Aβ40, but not p-tau181, p-tau217, GFAP, or NfL, were associated with the presence and progression of SCD. However, the inherent variability of SCD itself and the differences across its cognitive domains are reflected in their distinct associations with the AD biomarker profile. Therefore, the utility of plasma AD markers for screening at the SCD stage may require further exploration. We recommend incorporating domain-specific SCD assessment into community-based AD screening programs and monitoring domain-specific changes using comprehensive test batteries.
DECLARATIONS
Acknowledgments
The authors sincerely thank all Hubei Memory Aging Cohort Study (HMACS) personnel for their efforts in supporting this study’s implementation, and all HMACS participants for generously contributing their time, data, and specimens - their engagement is fundamental to this research on elderly cognitive impairment.
Authors’ contributions
Conceptualization: Liu N, Che J, Tan W
Visualization: Liu N
Investigation: Liu N, Liu L, Chen M, Peng Y, Tan W
Methodology: Zhang Y
Writing - original draft: Liu N
Validation: Zeng Y, Tan W
Writing - review and editing: Zeng Y, Tan W
Availability of data and materials
Data from the HMACS is available from the corresponding author upon reasonable request, subject to privacy and ethical restrictions.
AI and AI-assisted tool statement
Not applicable.
Financial support and sponsorship
This work was supported by Brain Science and Brain-like Intelligence Technology - National Science and Technology Major Project (2022ZD0211600), the National Natural Science Foundation of China (Grant Nos. 82571633 and 82371444), and Wuhan Municipal Key Research and Development Program Project (2025020602030093). The funders had no role in the study design, data analysis, manuscript writing, or decision to publish.
Conflicts of interest
All authors declared that there are no conflicts of interest.
Ethical approval and consent to participate
HMACS (ChiCTR, www.chictr.org.cn; Registration number: ChiCTR1800019164) was approved by the ethics committee at Wuhan University of Science and Technology (protocol code: 201845), Wuhan, China. Written informed consent was obtained from all participants or their proxies and was stored in the HMACS study office at WUST.
Consent for publication
Not applicable.
Copyright
© The Author(s) 2026.
Supplementary Materials
REFERENCES
1. Yang K, Yang X, Yin P, Zhou M, Tang Y. Temporal trend and attributable risk factors of Alzheimer’s disease and other dementias burden in China: findings from the Global Burden of Disease Study 2021. Alzheimers Dement. 2024;20:7871-84.
3. Rentz DM, Aisen PS, Atri A, et al. Benefits and risks of FDA‐approved amyloid‐targeting antibodies for treatment of early Alzheimer’s disease: navigating clinician-patient engagement. Alzheimers Dement. 2024;20:8162-71.
4. van Dyck CH, Swanson CJ, Aisen P, et al. Lecanemab in Early Alzheimer’s Disease. N Engl J Med. 2023;388:9-21.
5. Sims JR, Zimmer JA, Evans CD, et al. ; Donanemab in early symptomatic Alzheimer disease: the TRAILBLAZER-ALZ 2 randomized clinical trial. JAMA. 2023;330:512.
6. Márquez F, Tarraf W, Kuwayama S, et al. Subjective cognitive decline and cognitive change among diverse middle‐aged and older Hispanic/Latino adults: results from the Study of Latinos-Investigation of Neurocognitive Aging (SOL‐INCA). Alzheimers Dement. 2024;20:7715-28.
7. Jessen F, Amariglio RE, van Boxtel M, et al. ; Subjective Cognitive Decline Initiative (SCD‐I) Working Group. A conceptual framework for research on subjective cognitive decline in preclinical Alzheimer’s disease. Alzheimers Dement. 2014;10:844-52.
8. Jack CR Jr, Andrews JS, Beach TG, et al. Revised criteria for diagnosis and staging of Alzheimer’s disease: Alzheimer’s Association Workgroup. Alzheimers Dement. 2024;20:5143-69.
9. Shao K, Hu X, Kleineidam L, et al. ; DELCODE study group. Amyloid and SCD jointly predict cognitive decline across Chinese and German cohorts. Alzheimers Dement. 2024;20:5926-39.
10. Jessen F, Amariglio RE, Buckley RF, et al. The characterisation of subjective cognitive decline. Lancet Neurol. 2020;19:271-8.
11. Rabin LA, Smart CM, Amariglio RE. Subjective cognitive decline in preclinical Alzheimer’s disease. Annu Rev Clin Psychol. 2017;13:369-96.
12. Kang M, Li C, Mahajan A, et al. Subjective cognitive decline plus and longitudinal assessment and risk for cognitive impairment. JAMA Psychiatry. 2024;81:993-1002.
13. Pike KE, Cavuoto MG, Li L, Wright BJ, Kinsella GJ. Subjective cognitive decline: level of risk for future dementia and mild cognitive impairment, a meta-analysis of longitudinal studies. Neuropsychol Rev. 2022;32:703-35.
14. Baumeister H, Gellersen HM, Polk SE, et al. ; DELCODE study group. Disease stage-specific atrophy markers in Alzheimer’s disease. Alzheimers Dement. 2025;21:e70482.
15. Jiang X, Zhang M, Yan C, et al. Brain Topological Changes in Subjective Cognitive Decline and Associations with Amyloid Stages. J. Neurosci. 2025;45:e2310242025.
16. Wang X, Huang W, Su L, et al. Neuroimaging advances regarding subjective cognitive decline in preclinical Alzheimer’s disease. Mol Neurodegener. 2020;15:55.
17. Hong YJ, Choi SH, Kim S, et al. ; CoSCo study group. Cognitive and neurodegenerative trajectories of subjective cognitive decline according to baseline biomarkers: results of the CoSCo study. Alzheimers Dement. 2025;21:e14473.
18. Zlatar ZZ, Tarraf W, González KA, et al. Subjective cognitive decline and objective cognition among diverse U.S. Hispanics/Latinos: results from the Study of Latinos-Investigation of Neurocognitive Aging (SOL‐INCA). Alzheimers Dement. 2022;18:43-52.
19. Thomas KR, Edmonds EC. Objective criteria for subtle cognitive decline in aging and preclinical Alzheimer disease: a systematic review. Neurology. 2025;104:e213536.
20. Cheng GR, Liu D, Huang LY, et al. Prevalence and risk factors for subjective cognitive decline and the correlation with objective cognition among community‐dwelling older adults in China: Results from the Hubei memory and aging cohort study. Alzheimers Dement. 2023;19:5074-85.
21. Schneider LS, Freiesleben SD, van Breukelen G, et al. Linking higher amyloid beta 1-38 (Aβ(1‐38)) levels to reduced Alzheimer’s disease progression risk. Alzheimers Dement. 2025;21:e14545.
22. Chae H, Kim H, Kim Y, Ji H, Oh EJ, Yang DW. Diagnostic performance of eight blood-based biomarkers in a well-characterized Korean cohort of preclinical Alzheimer’s disease. Ann Lab Med. 2025;45:428-36.
23. Giacomucci G, Crucitti C, Ingannato A, et al. The two cut‐offs approach for plasma p‐tau217 in detecting Alzheimer’s disease in subjective cognitive decline and mild cognitive impairment. Alzheimers Dement. 2025;17:e70116.
24. Mengel D, Soter E, Ott JM, et al. ; DELCODE study group. Blood biomarkers confirm subjective cognitive decline (SCD) as a distinct molecular and clinical stage within the NIA-AA framework of Alzheimer’s disease. Mol Psychiatry. 2025;30:3150-9.
25. Shokouhi S, Conley AC, Baker SL, et al. The relationship between domain-specific subjective cognitive decline and Alzheimer’s pathology in normal elderly adults. Neurobiol Aging. 2019;81:22-9.
26. Wei M, Yu X, Hu S, et al. Differences of longitudinal plasma biomarkers between single memory domain and multidomain subjective cognitive decline: evidence from SILCODE. J Alzheimers Dis. 2025;103:1060-74.
27. Levine TF, Allison SL, Dessenberger SJ, Head D. ; Alzheimer’s Disease Neuroimaging Initiative. Clinical utility of self- and informant-reported memory, attention, and spatial navigation in detecting biomarkers associated with Alzheimer disease in clinically normal adults. J Int Neuropsychol Soc. 2024;30:232-43.
28. Xie XY, Huang LY, Cheng GR, et al. Association between long-term exposure to ambient air pollution and the risk of mild cognitive impairment in a Chinese urban area: a case-control study. J Alzheimers Dis. 2024;98:941-55.
29. Zhang J, Liu D, Liu J, et al. Effects of self-managed lifestyle behavioral changes on cognitive impairment control in Chinese older adults: a population-based prospective study. Transl Psychiatry. 2025;15:165.
30. Liu J, Liu D, Xie X, et al. Association between home dwelling situations, neighborhood social interactions, and subjective cognitive decline plus among older adults: a cross-sectional study. J Alzheimers Dis. 2025;104:1125-35.
31. Li L, Cheng GR, Liu D, et al. The Hubei Memory and Aging Cohort Study: study design, baseline characteristics, and prevalence of cognitive impairments. J Alzheimers Dis. 2022;85:561-71.
32. Hao L, Wang X, Zhang L, et al. Prevalence, risk factors, and complaints screening tool exploration of subjective cognitive decline in a large cohort of the Chinese population. J Alzheimers Dis. 2017;60:371-88.
33. Duff K. Evidence-based indicators of neuropsychological change in the individual patient: relevant concepts and methods. Arch Clin Neuropsychol. 2012;27:248-61.
34. Yesavage JA, Brink T, Rose TL, et al. Development and validation of a geriatric depression screening scale: a preliminary report. J Psychiatr Res. 1982;17:37-49.
37. Gifford KA, Liu D, Romano R 3rd, Jones RN, Jefferson AL. Development of a subjective cognitive decline questionnaire using item response theory: a pilot study. Alzheimers Dement. 2015;1:429-39.
38. Tomaszewski Farias S, Leng I, Papp K, et al. ; U.S. POINTER Study Group. Subjective cognitive decline among diverse older adults: prevalence and associations with objective cognition. Alzheimers Dement. 2025;21:e70432.
39. Gustavson DE, Jak AJ, Elman JA, et al. How well does subjective cognitive decline correspond to objectively measured cognitive decline? Assessment of 10-12 year change. J Alzheimers Dis. 2021;83:291-304.
40. Wolfsgruber S, Kleineidam L, Guski J, et al. ; DELCODE Study Group. Minor neuropsychological deficits in patients with subjective cognitive decline. Neurology. 2020;95:e1134-43.
41. Rosbergen MT, van der Veere P, Claus JJ, et al. Subcortical gray matter volumes and 5‐year dementia risk in individuals with subjective cognitive decline or mild cognitive impairment: a multi‐cohort analysis. Alzheimers Dement. 2025;21:e70413.
42. Melikyan ZA, Al-Darsani Z, Colcord KA, et al. Association of subjective memory complaints with neuropathologic changes at age 90 or older: the 90+ study. Neurology. 2025;105:e213948.
43. Arvanitakis Z, Shah RC, Bennett DA. Diagnosis and management of dementia: review. JAMA. 2019;322:1589-9.
44. Almeida FC, Marx GA, Rohde SK, et al. Cognitive and neuropsychological trajectories in patients with mixed neurodegenerative pathologies. Alzheimers Dement. 2025;21:e70575.
45. Wuestefeld A, Xie L, McGrew E, et al. ; Alzheimer’s Disease Neuroimaging Initiative. Tau, atrophy, and domain-specific cognitive impairment in typical Alzheimer’s disease. Alzheimers Dement. 2025;21:e70511.
46. Brenowitz WD, Hubbard RA, Keene CD, et al. Mixed neuropathologies and associations with domain-specific cognitive decline. Neurology. 2017;89:1773-81.
47. Yu X, Shi R, Zhou X, et al. Correlations between plasma markers and brain Aβ deposition across the AD continuum: Evidence from SILCODE. Alzheimers Dement. 2024;20:6170-82.
48. Márquez F, Tarraf W, Gonzalez K, et al. Alzheimer disease biomarkers and subjective cognitive decline among Hispanic and/or Latino adults. JAMA Netw Open. 2025;8:e2531038.
49. Jack CR Jr, Bennett DA, Blennow K, et al.; Contributors. NIA‐AA Research Framework: toward a biological definition of Alzheimer’s disease. Alzheimers Dement. 2018;14:535-62.
50. Shao K, Hu X, Buerger K, et al. ; DELCODE study group and SILCODE study group. Longitudinal cognitive changes in SCD participants in relation to plasma amyloid status and the potential additive effect of plasma ptau181 levels: a CLoCODE study. Alzheimers Dement. 2025;20:e086729.
51. Kubota M, Bun S, Takahata K, et al. Plasma biomarkers for early detection of alzheimer’s disease: a cross-sectional study in a Japanese cohort. Alzheimers Res Ther. 2025;17:131.
52. Goyal MS, Blazey TM, Su Y, et al. Persistent metabolic youth in the aging female brain. Proc Natl Acad Sci. U S A. 2019;116:3251-5.
Cite This Article
How to Cite
Download Citation
Export Citation File:
Type of Import
Tips on Downloading Citation
Citation Manager File Format
Type of Import
Direct Import: When the Direct Import option is selected (the default state), a dialogue box will give you the option to Save or Open the downloaded citation data. Choosing Open will either launch your citation manager or give you a choice of applications with which to use the metadata. The Save option saves the file locally for later use.
Indirect Import: When the Indirect Import option is selected, the metadata is displayed and may be copied and pasted as needed.
About This Article
Copyright

Data & Comments
Data
0


Comments
Comments must be written in English. Spam, offensive content, impersonation, and private information will not be permitted. If any comment is reported and identified as inappropriate content by OAE staff, the comment will be removed without notice. If you have any queries or need any help, please contact us at [email protected].