


The limb-to-waist ratio: resolving the divergence between mortality and cardiovascular risk
 0
0 
Abstract
Aim: We aimed to resolve the paradoxical associations of limb circumference—inverse with mortality but positive with cardiovascular risk factors (CVRFs)—by systematically comparing the predictive value of the ratio of combined arm and thigh circumference (ATC) to waist circumference (WC) against that of the sum of ATC for mortality and key CVRFs.
Methods: Our analysis utilized data from 17,276 U.S. participants in the 1999-2006 NHANES (National Health and Nutrition Examination Survey). We utilized Cox proportional hazards, generalized linear, and restricted cubic spline models, with comprehensive adjustment for confounders including adiposity. The outcomes assessed were all-cause and cardiovascular mortality, hypertension, diabetes, and resting tachycardia.
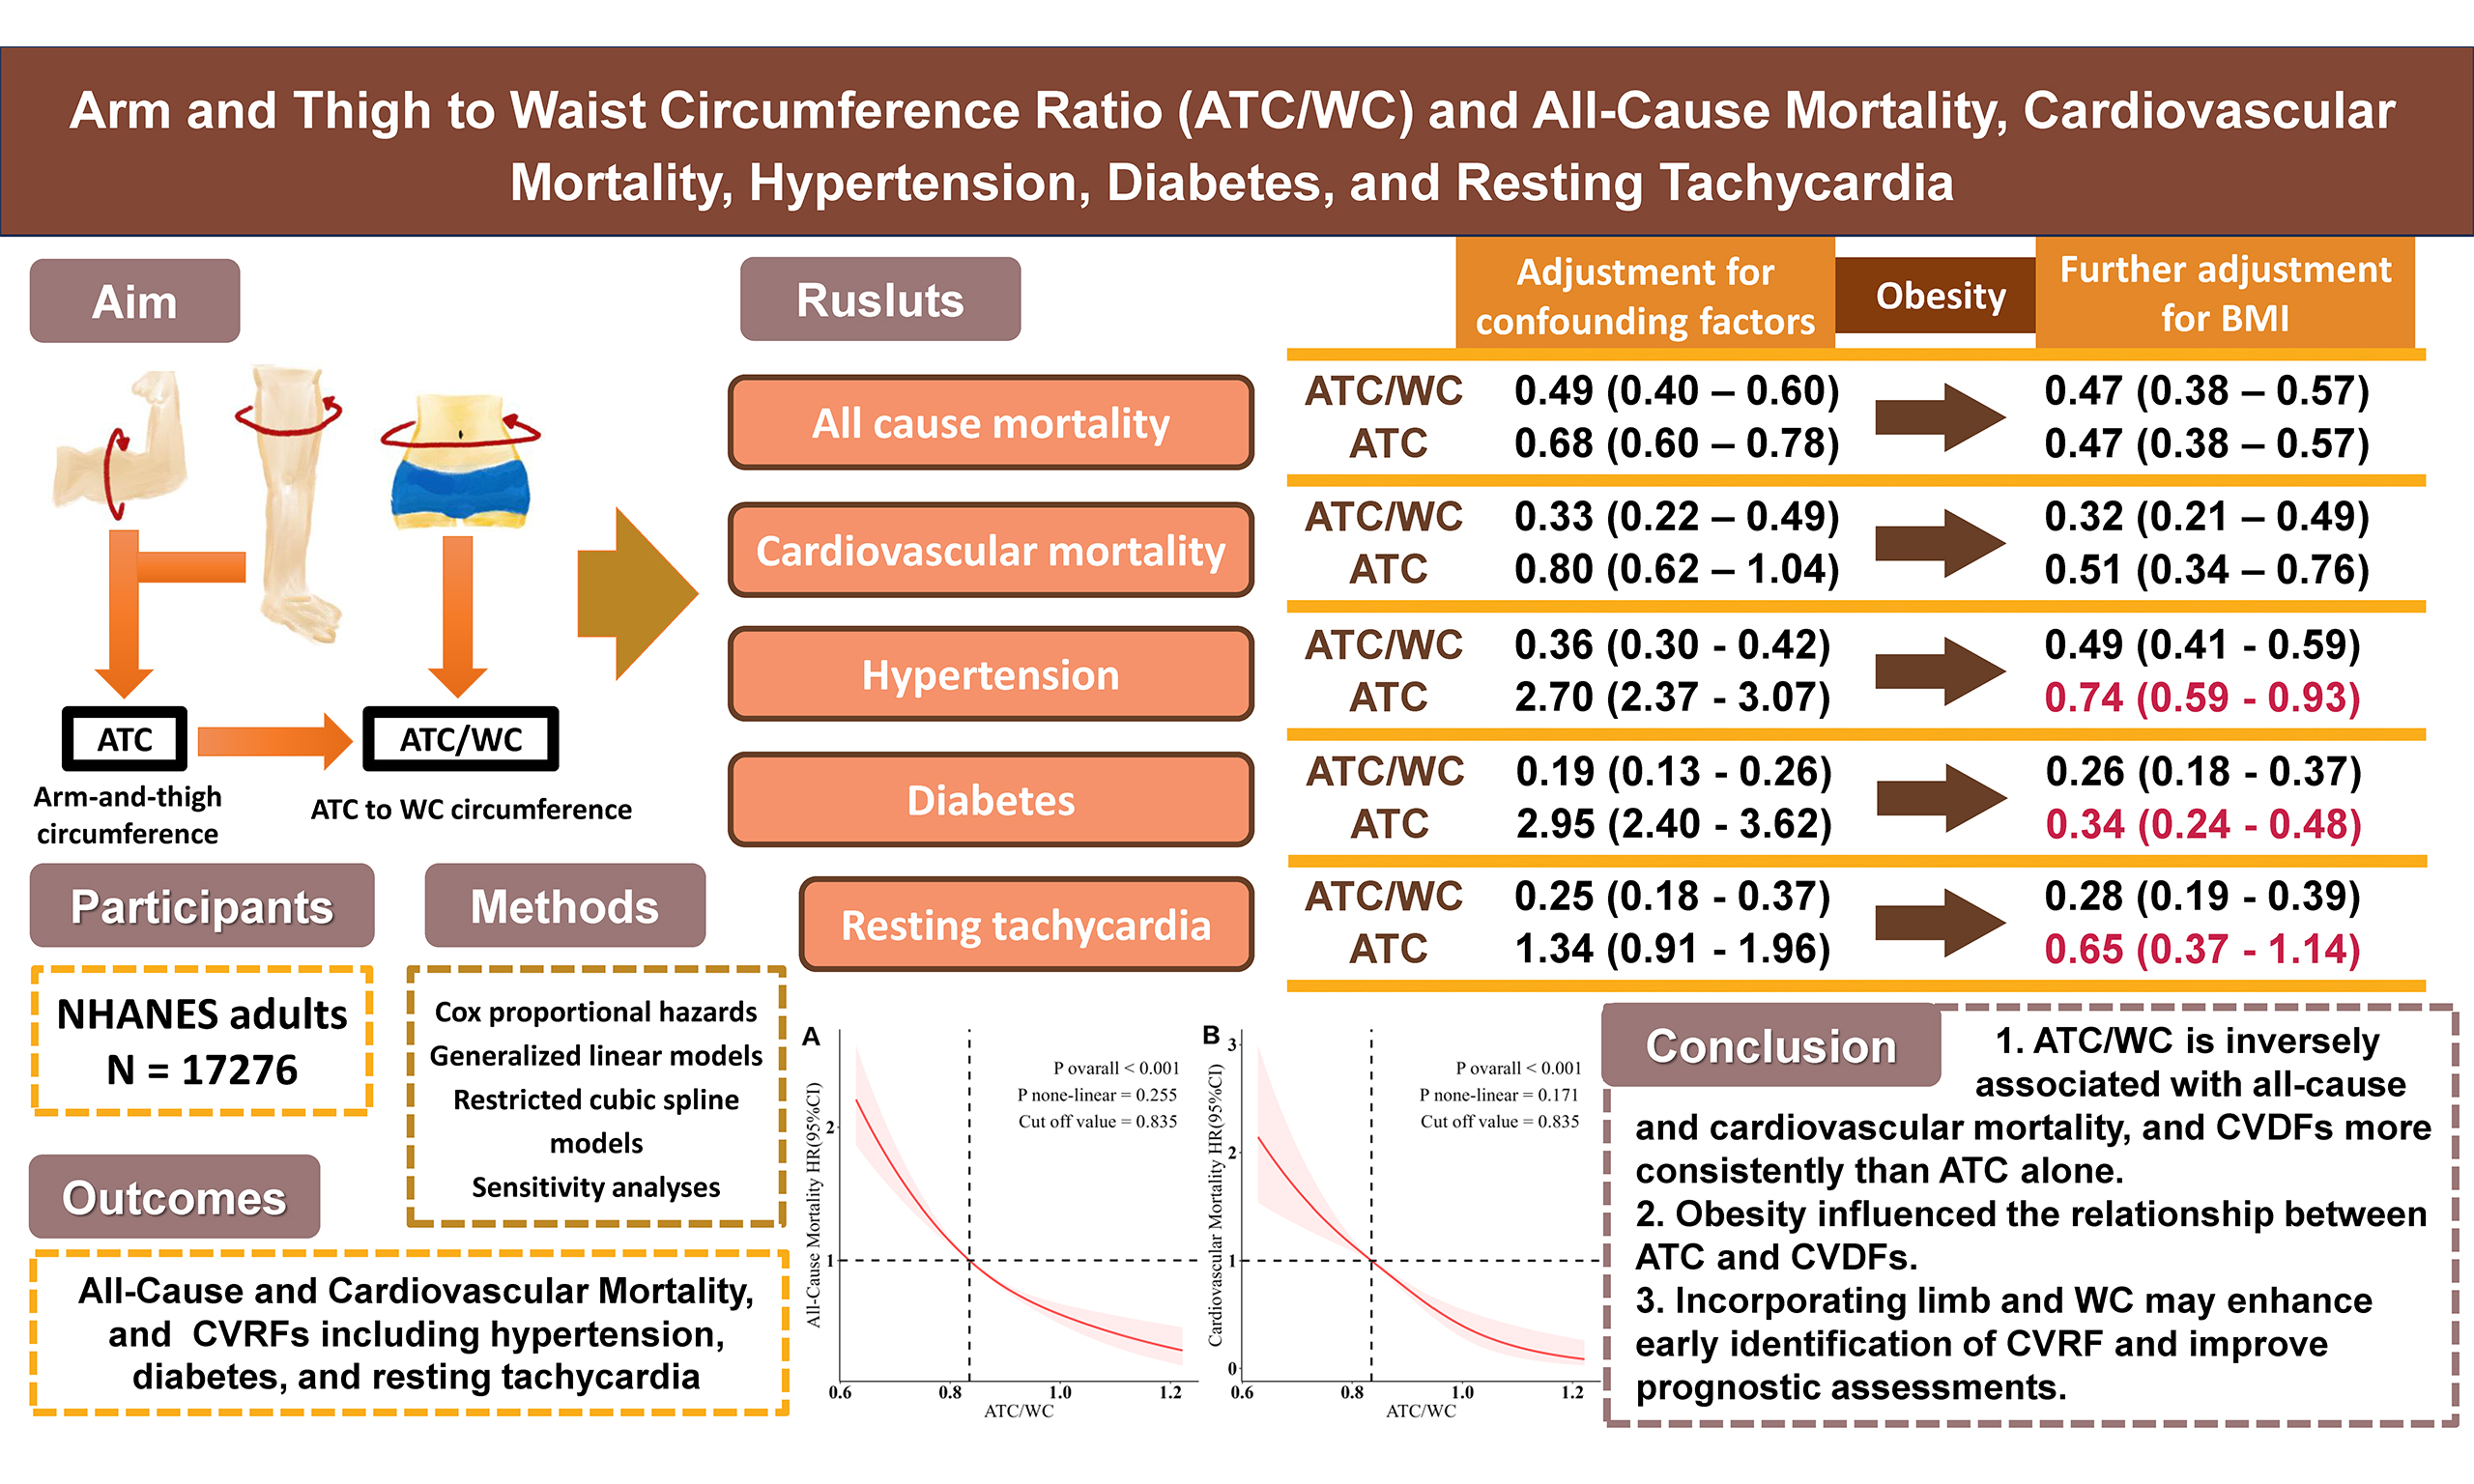
Results: During median 18.04-year follow-up (3,927 deaths, 1,047 cardiovascular deaths), the highest versus lowest ATC/WC quartile showed consistently protective associations: all-cause mortality (hazard ratio (HR) = 0.47, 95% confidence interval (95%CI): 0.38-0.57), cardiovascular mortality (HR = 0.32, 0.21-0.49), hypertension (OR = 0.49, 0.41-0.59), diabetes (odds ratio (OR) = 0.26, 0.18-0.37), and resting tachycardia (OR = 0.28, 0.19-0.39; all
Conclusion: The ATC/WC ratio consistently demonstrates protective associations with both mortality and CVRFs. The waist standardization approach clarifies the relationship between limb measurements, cardiovascular health, and mortality by adjusting for central adiposity-related confounding that limits the utility of absolute rather than relative peripheral limb measurements.
Keywords
INTRODUCTION
Cardiovascular disease (CVD) stands as the preeminent contributor to the global burden of mortality[1]. Early intervention on modifiable risk factors prior to the onset of endpoint events is crucial for reducing the disease burden[2,3]. Limb circumferences reflect the composition of peripheral limbs, primarily comprising muscle mass, subcutaneous fat, bone structure, and excessive or ectopic adipose tissue[4-6]. Numerous studies have indicated that larger limb circumferences are consistently linked to a reduction in risk for both all-cause and cardiovascular mortality, suggesting their potential as markers of overall health and nutritional status[7].
However, the associations between limb circumference and specific cardiovascular risk factors (CVRFs), including hypertension and diabetes, are complex and inconsistent. Some studies associate larger limb circumferences with a higher risk of these conditions[8-11], while others have reported no association or even a protective effect against these risks[12-14]. This apparent paradox, where benefits for mortality contrast with mixed effects on risk factors, constitutes a significant scientific question. We hypothesize that this discrepancy stems from the fact that limb circumference is a composite measure, simultaneously capturing both metabolically beneficial tissues (e.g., lean mass, bone, subcutaneous fat) and potentially detrimental adipose tissue[15-17]. This heterogeneity in composition makes the health effects of a simple circumference measurement difficult to interpret clearly. Waist circumference (WC) is a reliable indicator of central obesity and visceral fat accumulation, which is a key driver of cardiometabolic risk[18]. Therefore, we propose that standardizing limb circumference for WC (e.g., by calculating a ratio) may effectively adjust for overall adiposity. Under this premise, a protective association between this ratio and health outcomes could be interpreted as primarily reflecting the relative abundance of protective tissues (e.g., muscle, subcutaneous fat) in the limbs relative to the level of overall adiposity, offering a mechanistic explanation for the aforementioned contradiction. Preliminary evidence from two studies supports that limb circumference-to-waist circumference ratios are associated with reduced mortality and increased muscle mass and strength[19,20]; however, their association with comprehensive cardiovascular health outcomes, including both mortality and multiple CVRFs, has not been systematically evaluated.
To address this gap, this study utilizes National Health and Nutrition Examination Survey (NHANES) data to evaluate the ratios of upper-arm and thigh circumference to WC. Their associations with prospective mortality outcomes (all-cause, cardiovascular) and cross-sectional conditions outcomes (hypertension, diabetes, resting tachycardia) will be evaluated using longitudinal and cross-sectional analyses, respectively.
METHODS
Study design and participants
NHANES utilizes a multi-stage probability-based sampling methodology to yield a nationally representative sample of the non-institutionalized U.S. civilian population. Since 1999, NHANES has operated in two-year cycles, collecting comprehensive data through interviews, physical examinations, and laboratory analyses. Detailed study design information is publicly available[21]. A total of 41,474 subjects participated in NHANES between 1999 and 2006. After excluding 18,850 participants aged less than 18, 4,498 with missing hypertension, diabetes, and heart rate data, 835 missing AC, TC, and WC data, and 15 lacking mortality data, we ended up with a final of 17,276 individuals [Supplementary Figure 1]. The use of de-identified, publicly available NHANES data waived the requirement for Institutional Review Board review.
Limb and waist circumference measurements
Trained healthcare technicians measured right arm circumference (AC), right thigh circumference (TC), and WC following standardized protocols. The left limb was measured if the right was unavailable. For AC, participants stood with arms naturally hanging, elbows bent at 90°, and palms facing upward. AC was measured at the midpoint between the acromion's posterior edge and the olecranon process (tip of the elbow), with the tape positioned perpendicular to the long axis of the upper arm. For TC, participants first sat with knees bent at 90°, and a mark was made at the midpoint between the inguinal crease and the proximal edge of the patella. Participants then stood, shifted their weight to the left leg, slightly flexed the right leg forward, and TC was measured perpendicular to the long axis at the marked point. WC was measured while standing by marking a horizontal line just above the right iliac crest and measuring WC along this line. All measurements were recorded to the nearest millimeter. The sum of arm and thigh circumference (ATC) was defined as the sum of unilateral AC and TC, and ATC/WC was calculated as the ratio of ATC to WC.
Mortality and cardiovascular risk factors
Using a unique identifier, each participant was linked to the National Death Index, with follow-up for mortality available through December 31, 2019[22]. Mortality endpoints included death from any cause (all-cause mortality) and death from cardiovascular diseases, as determined by the following ICD-10 codes: I00-I09, I11, I13, and I20-I51.
Blood pressure (BP), blood samples, resting heart rate measurements, and related questionnaire data were collected at baseline. BP was measured at the Mobile Examination Center (MEC) using a mercury sphygmomanometer. After a 5-min seated rest, three consecutive readings of systolic and diastolic BP were obtained after determining the maximum inflation level; a fourth reading was taken if any measurement was unsuccessful. The final BP value was the average of the valid readings. Hypertension was defined as systolic BP exceeding 140 mmHg, diastolic BP exceeding 90 mmHg, and/or a self-reported physician diagnosis. Blood samples were rapidly centrifuged after collection at the MEC and sent to Johns Hopkins Hospital (Baltimore, MD), where fasting glucose and hemoglobin A1c (HbA1c) levels were determined using a Hitachi automated analyzer. Diabetes was defined as fasting blood glucose over
Covariates
Covariates were selected based on established clinical and epidemiological relevance, and were categorized into three domains. (1) Sociodemographic factors: age (categorized as 18-30, 30-42, 42-54, 54-66, > 66 years), sex, race/ethnicity, education level, marital status, and family income-to-poverty ratio (< 1 or ≥ 1); (2) Lifestyle factors: smoking and alcohol consumption status; (3) Physical health indicators: body mass index (BMI), serum creatinine, urine albumin-to-creatinine ratio (uACR), and history of underlying diseases. Participants were considered to have a history of underlying diseases if they reported a prior diagnosis of bronchitis, asthma, coronary heart disease, congestive heart failure, stroke, or malignant tumors.
Statistical analyses
Analyses accounted for the NHANES complex survey design (weights, clustering, stratification) and were performed in R 4.5.1. Missing covariate data were imputed via random forest. Continuous variables are summarized as weighted mean (standard deviation), and categorical variables as weighted frequency (percentage). Group comparisons utilized the weighted Kruskal-Wallis test for continuous variables and the weighted chi-square test for categorical variables. A two-sided P-value < 0.05 was deemed statistically significant.
To evaluate survival patterns, Kaplan-Meier curves were generated for ATC/WC and ATC across age subgroups, stratified by all-cause and cardiovascular mortality. To assess mortality risk, Cox proportional hazards models were fitted. The associations of ATC/WC and ATC with hypertension, diabetes, and resting tachycardia were examined using generalized linear models. We employed a multi-model adjustment strategy. Model 1 was unadjusted (crude); Model 2 adjusted for basic sociodemographic and lifestyle factors, including smoking and alcohol consumption; Model 3 further adjusted for clinical measures and comorbidities, including serum creatinine, uACR, dyslipidemia, and a history of underlying diseases—and, for mortality outcomes, additionally for baseline hypertension, diabetes, and tachycardia; and Model 4 additionally adjusted for BMI (fully adjusted). For ATC, a sensitivity analysis (Model 5) replaced adjustment for BMI with adjustment for WC. In Model 4, potential nonlinearity was explored using restricted cubic splines with three knots.
We conducted an extensive set of sensitivity analyses. First, we performed subgroup analyses based on age, sex, hypertension, diabetes, smoking status, and history of underlying diseases to assess how ATC/WC and ATC were related to both all-cause and cardiovascular mortality, as well as to CVRFs. Second, we substituted measured BP values for the hypertension diagnosis variable, fasting glucose measurements for the diabetes diagnosis variable, and resting heart rate measurements for the resting tachycardia variable, utilizing linear regression to assess the correlations between ATC/WC, ATC, and CVRFs—to mitigate potential misclassification and validate our primary findings. Finally, to deconstruct the composite metrics, we evaluated the individual components: we examined the associations of unilateral AC and TC separately with mortality and CVRF, and we also constructed and tested arm-to-waist (AC/WC) and thigh-to-waist (TC/WC) ratios.
RESULTS
Baseline characteristics
This study comprised a final cohort of 17,276 individuals. According to weighted quartiles of ATC/WC (cut points: 0.839, 0.902, 0.965), participants were categorized into four groups: Q1 (n = 5,213), Q2 (n = 4,112), Q3 (n = 3,776), and Q4 (n = 4,175). Over a median follow-up of 18.04 years (totaling 358,477 person-years), 3,927 deaths occurred, including 1,047 cardiovascular deaths. The cohort had a mean age of 46.08 (±20.12) years and was 52% female. As detailed in Table 1, when contrasting baseline characteristics, individuals in Q4 were generally younger, had higher educational attainment, and lower smoking prevalence than those in Q1. They also presented with more favorable anthropometric and clinical profiles, including lower values for WC, weight, BMI, serum creatinine, total cholesterol, BP, and resting heart rate. Moreover, the prevalence of multiple comorbidities—including proteinuria, hypertension, diabetes, dyslipidemia, chronic bronchitis, coronary heart disease, heart failure, stroke, and cancer—was lower in Q4 relative to Q1.
Distribution of baseline characteristics across quartiles of ATC/WC
| Characteristics | Total | Q1a | Q2 | Q3 | Q4 | P value |
| Number | 17,276 | 5,213 | 4,112 | 3,776 | 4,175 | |
| Female (%) | 9,008 (52.0) | 2,333 (42.4) | 2,142 (47.8) | 2,126 (54.8) | 2,407 (63.1) | < 0.0001 |
| Age, years | 46.08 (20.12) | 60.24 (18.40) | 48.02 (17.86) | 39.65 (16.52) | 32.31 (14.50) | < 0.0001 |
| Age group (%) | < 0.0001 | |||||
| ≥ 18 and ≤ 30 | 5,007 (23.5) | 548 (6.7) | 830 (15.2) | 1,318 (27.7) | 2,311 (44.4) | |
| > 30 and ≤ 42 | 3,185 (23.8) | 442 (11.1) | 833 (24.3) | 976 (31.2) | 934 (28.8) | |
| > 42 and ≤ 54 | 3,023 (24.4) | 728 (23.3) | 964 (30.8) | 774 (25.3) | 557 (18.2) | |
| > 54 and ≤ 66 | 2,630 (14.7) | 1,207 (24.8) | 766 (17.7) | 421 (10.3) | 236 (6.2) | |
| > 66 | 3,431 (13.5) | 2,288 (34.1) | 719 (12.0) | 287 (5.5) | 137 (2.5) | |
| Ethnicity (%) | < 0.0001 | |||||
| Mexican American | 3,997 (7.5) | 1,331 (7.3) | 1,095 (9.4) | 917 (8.0) | 654 (5.3) | |
| Non-Hispanic Black | 3,544 (10.6) | 543 (5.4) | 703 (8.4) | 757 (9.9) | 1,541 (18.6) | |
| Non-Hispanic White | 8,398 (72.3) | 2,990 (79.0) | 1,982 (72.5) | 1,777 (71.5) | 1,649 (66.4) | |
| Others | 1,337 (9.6) | 349 (8.3) | 332 (9.7) | 325 (10.6) | 331 (9.8) | |
| Married (%) | 9,916 (63.5) | 3,350 (67.3) | 2,654 (68.0) | 2,165 (65.1) | 1,747 (53.5) | < 0.0001 |
| High School or above (%) | 12,060 (80.9) | 3,185 (74.7) | 2,801 (79.7) | 2,788 (84.2) | 3,286 (85.1) | < 0.0001 |
| Not poor (%) | 13,900 (87.2) | 4,244 (87.1) | 3,297 (87.3) | 3,049 (87.7) | 3,310 (86.6) | 0.703 |
| Currently smoking (%) | 3,381 (23.8) | 914 (22.5) | 936 (26.4) | 786 (23.7) | 745 (22.6) | 0.014 |
| Currently drinking (%) | 1,1,782 (72.8) | 3,432 (69.5) | 2,826 (73.8) | 2,580 (73.0) | 2,944 (74.8) | 0.0017 |
| WC, cm | 96.44 (15.49) | 106.29(13.91) | 99.21 (13.17) | 92.88 (12.86) | 84.64 (12.32) | < 0.0001 |
| BMI, kg/m2 | 28.08 (6.17) | 29.44 (6.00) | 28.76 (5.96) | 27.57 (6.05) | 26.18 (6.18) | < 0.0001 |
| HDL-C, mg/dLb | 53.28 (15.83) | 50.97 (15.83) | 52.12 (16.22) | 53.28 (15.44) | 56.37 (15.44) | < 0.0001 |
| Total cholesterol, mg/dLb | 198.84 (44.02) | 207.34 (45.17) | 207.34 (44.79) | 196.14 (42.47) | 182.63 (38.22) | < 0.0001 |
| Creatinine, mg/dLb | 0.88 (0.45) | 0.94 (0.56) | 0.86 (0.46) | 0.84 (0.37) | 0.86 (0.32) | < 0.0001 |
| uACR, mg/g | 48.66 (408.06) | 98.82 (633.05) | 36.68 (335.95) | 23.81 (222.81) | 20.29 (167.44) | < 0.0001 |
| Comorbidity Model (%) | 4,258 (25.0) | 1,829 (37.4) | 942 (23.2) | 707 (18.8) | 780 (20.7) | < 0.0001 |
| Coronary artery disease (%) | 666 (3.4) | 447 (8.6) | 139 (3.3) | 52 (1.0) | 28 (0.6) | < 0.0001 |
| Congestive heart failure (%) | 470 (2.1) | 318 (5.6) | 84 (1.5) | 48 (1.0) | 20 (0.3) | < 0.0001 |
| Stroke (%) | 512 (2.4) | 310 (5.2) | 118 (2.4) | 54 (1.5) | 30 (0.7) | < 0.0001 |
| Chronic bronchitis (%) | 427 (2.8) | 180 (4.2) | 116 (3.3) | 81 (2.3) | 50 (1.5) | < 0.0001 |
| Asthma (%) | 2,046 (12.9) | 560 (12.8) | 439 (11.5) | 443 (11.9) | 604 (15.5) | 0.0003 |
| Cancer (%) | 1,327 (8.1) | 726 (15.6) | 304 (7.3) | 166 (5.0) | 131 (4.5) | < 0.0001 |
| SBP, mmHg | 124.36 (20.34) | 132.47 (22.45) | 125.64 (20.26) | 120.23 (17.57) | 116.73 (15.56) | < 0.0001 |
| DBP, mmHg | 69.33 (14.02) | 68.69 (16.04) | 70.90 (13.79) | 69.82 (13.21) | 68.14 (11.92) | < 0.0001 |
| Heart rate, beats/ min | 72.78 (12.66) | 73.43 (13.70) | 73.19 (12.76) | 72.77 (12.01) | 71.59 (11.64) | < 0.0001 |
| Hypertension (%) | 6,454 (34.7) | 3,063 (59.2) | 1,650 (37.1) | 1,018 (25.6) | 723 (17.1) | < 0.0001 |
| Diabetes (%) | 2,187 (10.3) | 1,365 (24.5) | 497 (9.8) | 197 (4.1) | 128 (2.7) | < 0.0001 |
| Hyperlipidemia (%) | 11,885 (66.9) | 4,142 (81.4) | 3,096 (74.7) | 2,414 (62.5) | 2,233 (49.2) | < 0.0001 |
Associations of ATC/WC and ATC with mortality
Kaplan-Meier analyses stratified by age indicated protective associations for both ATC/WC and ATC with mortality, though the associations emerged in different age groups [Supplementary Figures 2 and 3]. This study evaluated the association between the ATC/WC ratio and mortality using multivariable-adjusted Cox proportional hazards models, confirming significant and independent inverse associations (see Table 2 for details). In Model 3, which did not adjust for BMI or waist circumference, participants in the highest quartile (Q4) of ATC/WC, compared to those in the lowest quartile (Q1), showed a significantly lower risk of all-cause mortality, with a hazard ratio (HR) of 0.49 (95% confidence interval [CI]: 0.40-0.60). The reduction in cardiovascular mortality risk was more pronounced, with an HR of 0.33 (95% confidence interval (95%CI): 0.22-0.49). Notably, the strength of these protective associations remained virtually unchanged after further adjustment for BMI in Model 4 (all-cause mortality: HR = 0.47, 95%CI: 0.38-0.57; cardiovascular mortality: HR = 0.32, 95%CI: 0.21-0.49), demonstrating that ATC/WC effectively accounts for adiposity.
Cox proportional hazards model for ATC/WC, ATC and all-cause and cardiovascular mortality
| Characteristics | Model 1a HR (95%CI) | Model 2b HR (95%CI) | Model 3c HR (95%CI) | Model 4d HR (95%CI) | Model 5e HR (95%CI) | |
| All-cause death (3,927/17,276) | ||||||
| ATC/WC | ||||||
| Q1 | Ref | Ref | Ref | Ref | - | |
| Q2 | 0.33 (0.30-0.37) | 0.63 (0.56-0.72) | 0.72 (0.63-0.82) | 0.70 (0.61-0.80) | - | |
| Q3 | 0.18 (0.16-0.21) | 0.58 (0.50-0.67) | 0.68 (0.58-0.79) | 0.65 (0.55-0.77) | - | |
| Q4 | 0.09 (0.08-0.11) | 0.42 (0.35-0.52) | 0.49 (0.40-0.60) | 0.47 (0.38-0.57) | - | |
| p for trend | < 0.001* | < 0.001* | < 0.001* | < 0.001* | - | |
| ATC | ||||||
| Q1 | Ref | Ref | Ref | Ref | Ref | |
| Q2 | 0.61 (0.56-0.67) | 0.66 (0.59-0.73) | 0.65 (0.58-0.72) | 0.58 (0.52-0.66) | 0.56 (0.49-0.63) | |
| Q3 | 0.52 (0.46-0.59) | 0.65 (0.59-0.73) | 0.60 (0.54-0.68) | 0.50 (0.43-0.58) | 0.46 (0.41-0.53) | |
| Q4 | 0.47 (0.41-0.54) | 0.78 (0.68-0.90) | 0.68 (0.60-0.78) | 0.47 (0.38-0.57) | 0.42 (0.35-0.51) | |
| p for trend | < 0.001* | < 0.001* | < 0.001* | < 0.001* | < 0.001* | |
| Cardiovascular death (1,047/17,276) | ||||||
| ATC/WC | ||||||
| Q1 | Ref | Ref | Ref | Ref | - | |
| Q2 | 0.32 (0.26-0.40) | 0.63 (0.51-0.79) | 0.73 (0.58-0.93) | 0.73 (0.57-0.93) | - | |
| Q3 | 0.13 (0.09-0.18) | 0.44 (0.31-0.63) | 0.55 (0.38-0.79) | 0.54 (0.37-0.79) | - | |
| Q4 | 0.05 (0.03-0.07) | 0.25 (0.17-0.40) | 0.33 (0.22-0.49) | 0.32 (0.21-0.49) | - | |
| p for trend | < 0.001* | < 0.001* | < 0.001* | < 0.001* | - | |
| ATC | ||||||
| Q1 | Ref | Ref | Ref | Ref | Ref | |
| Q2 | 0.61 (0.50-0.75) | 0.64 (0.53-0.78) | 0.62 (0.51-0.75) | 0.54 (0.45-0.66) | 0.51 (0.42-0.62) | |
| Q3 | 0.53 (0.43-0.65) | 0.66 (0.52-0.83) | 0.57 (0.45-0.72) | 0.45 (0.35-0.59) | 0.41 (0.32-0.53) | |
| Q4 | 0.57 (0.43-0.74) | 0.98 (0.76-1.25) | 0.80 (0.62-1.04) | 0.51 (0.34-0.76) | 0.43 (0.31-0.61) | |
| p for trend | < 0.001* | 0.474 | 0.037* | < 0.001* | < 0.001* | |
In contrast, the associations for ATC were confounded by overall adiposity. In model 3 (without BMI/WC adjustment), a higher ATC (Q4 vs. Q1) was associated with only a modest reduction in all-cause mortality risk (HR = 0.68, 95%CI: 0.60-0.78), while its association with cardiovascular mortality did not reach statistical significance (HR = 0.80, 95%CI: 0.62-1.04). However, after adjusting for BMI in model 4, the associations strengthened substantially, becoming significantly inverse for both all-cause (HR = 0.47, 95%CI: 0.38-0.57) and cardiovascular mortality (HR = 0.51, 95%CI: 0.34-0.76). This reversal underscores that the true protective effect of limb circumference is masked by its correlation with general obesity and requires control for adiposity.
RCS analyses visually supported these associations. For the ATC/WC, the relationship with mortality was significantly linear. The P-value for non-linearity was 0.255 for all-cause [Figure 1A] and 0.171 for cardiovascular mortality [Figure 1B]. The mortality risk decreased steadily as ATC/WC increased, with a threshold of notable protection above a value of 0.835. In contrast, the association between ATC and mortality was significantly non-linear (P for non-linearity < 0.001), as detailed in Supplementary Figure 4.
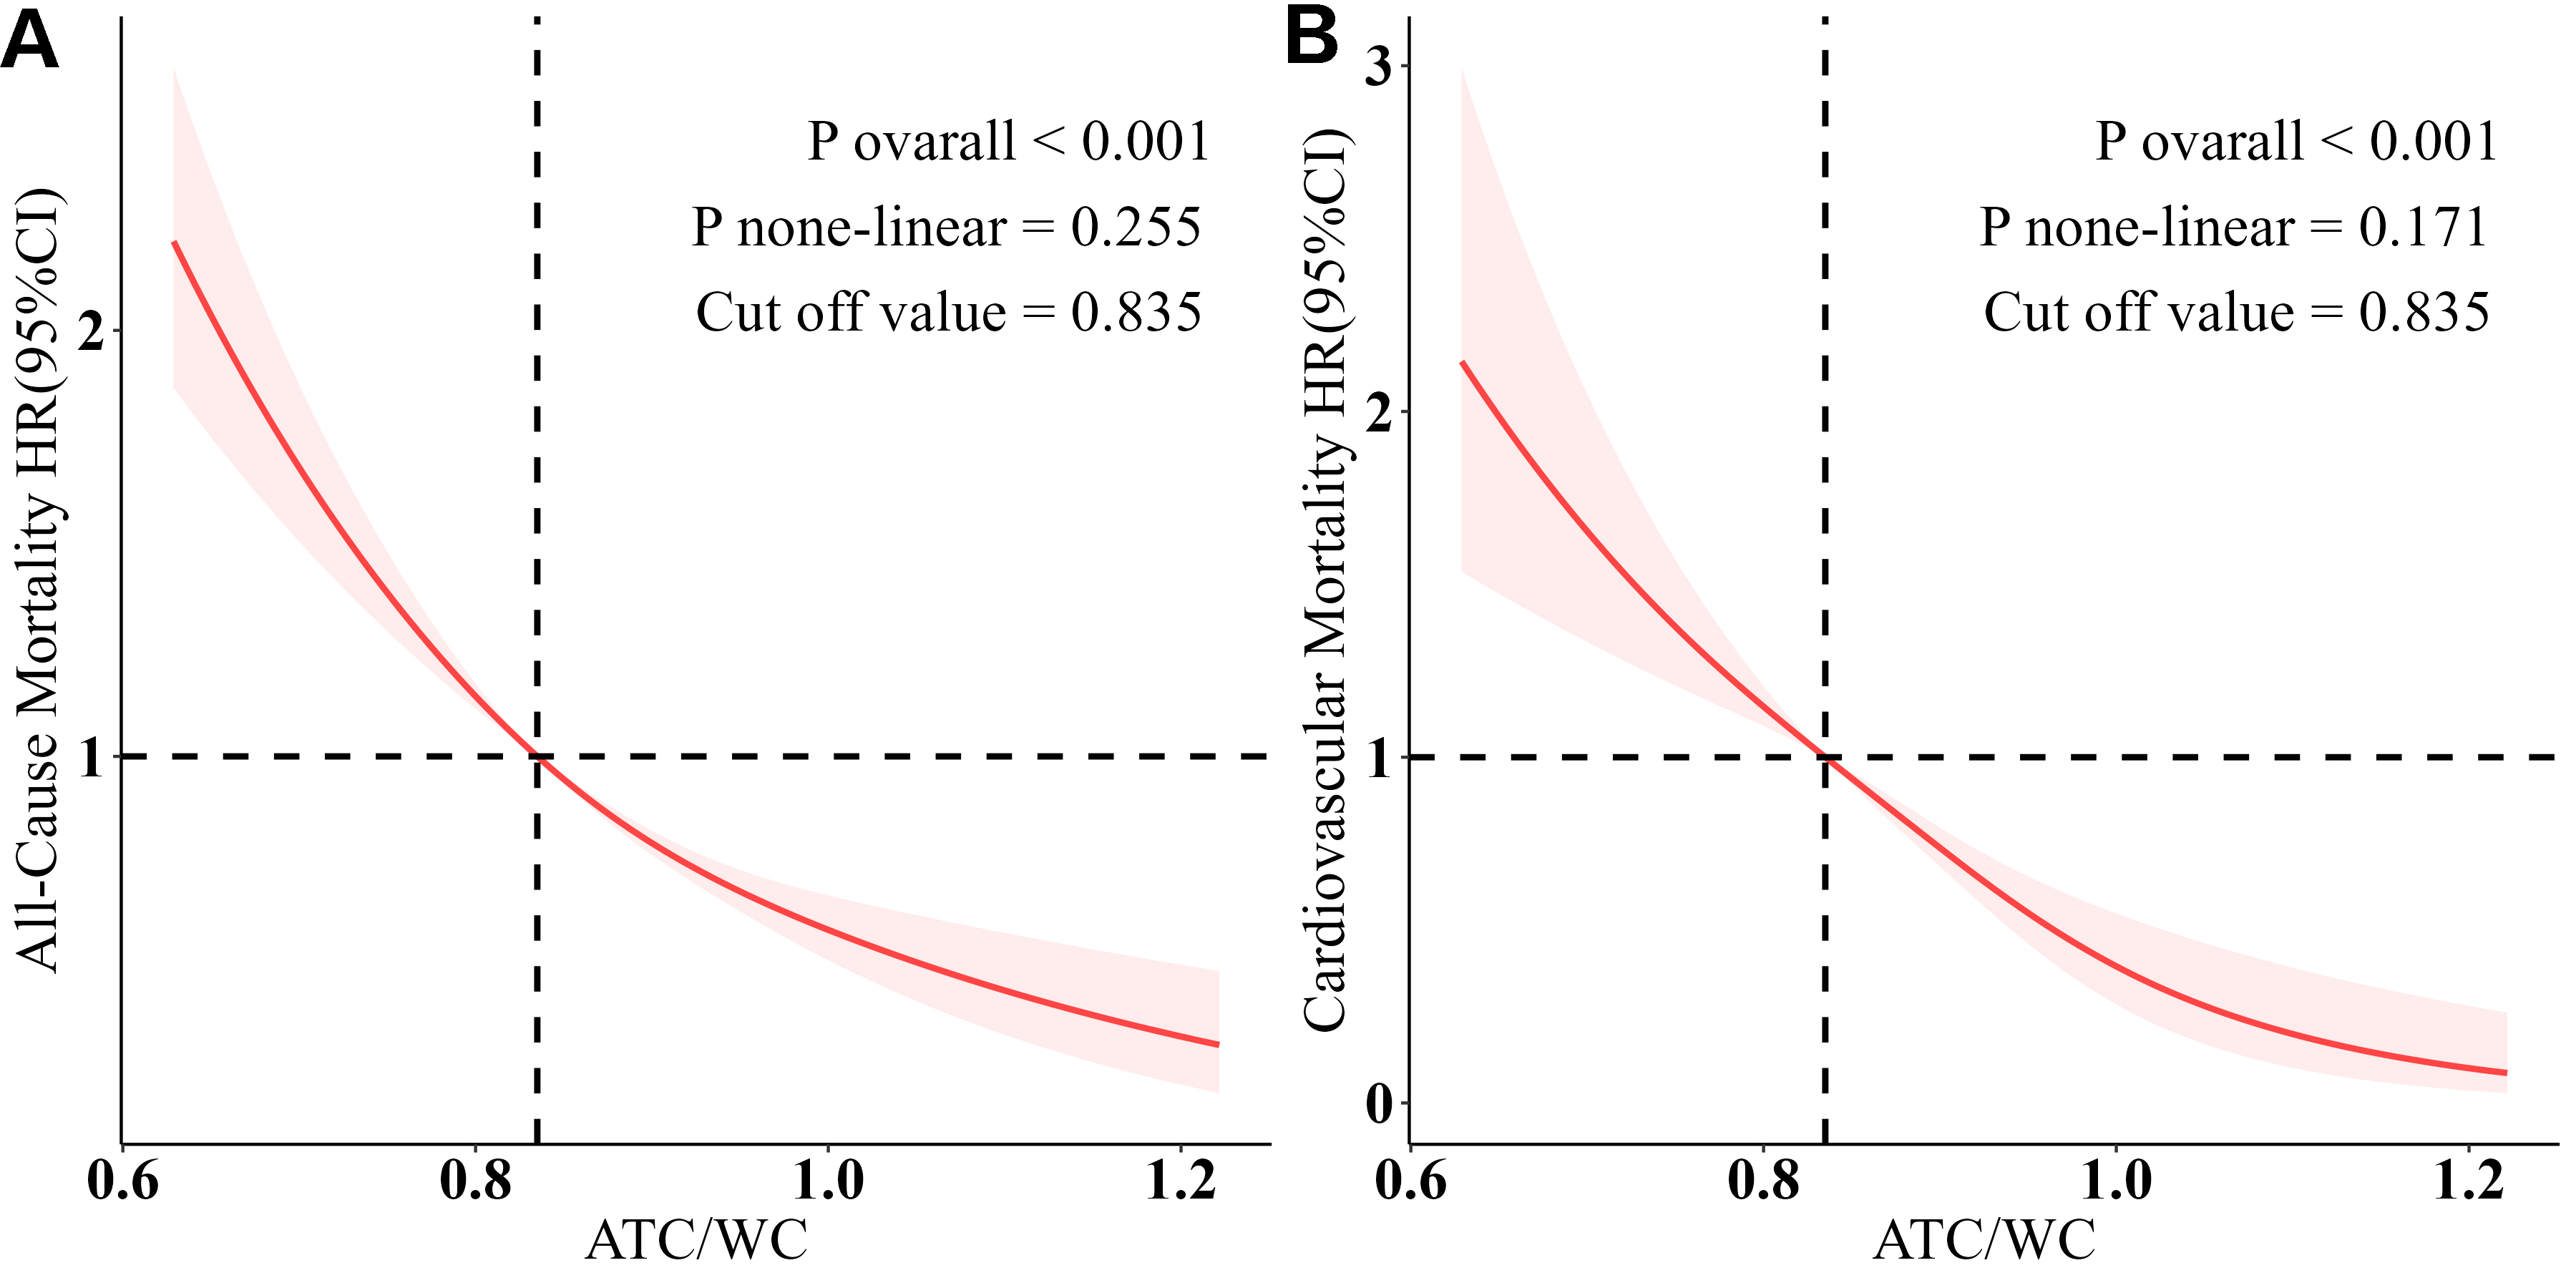
Figure 1. ATC/WC and all-cause mortality and cardiovascular mortality. The association was analyzed using a restricted cubic spline model, adjusted for age, sex, race, marital status, education, family income-poverty ratio, BMI, smoking, drinking, creatinine, uACR, hyperlipidemia, and history of underlying diseases. (A) Association between ATC/WC and all-cause mortality. (B) Association between ATC/WC and cardiovascular mortality.
Associations of ATC/WC and ATC with cardiovascular risk factors
The prevalence of hypertension [Figure 2A], diabetes [Figure 2B], and resting tachycardia [Figure 2C] decreased significantly with increasing quartiles of ATC/WC (all
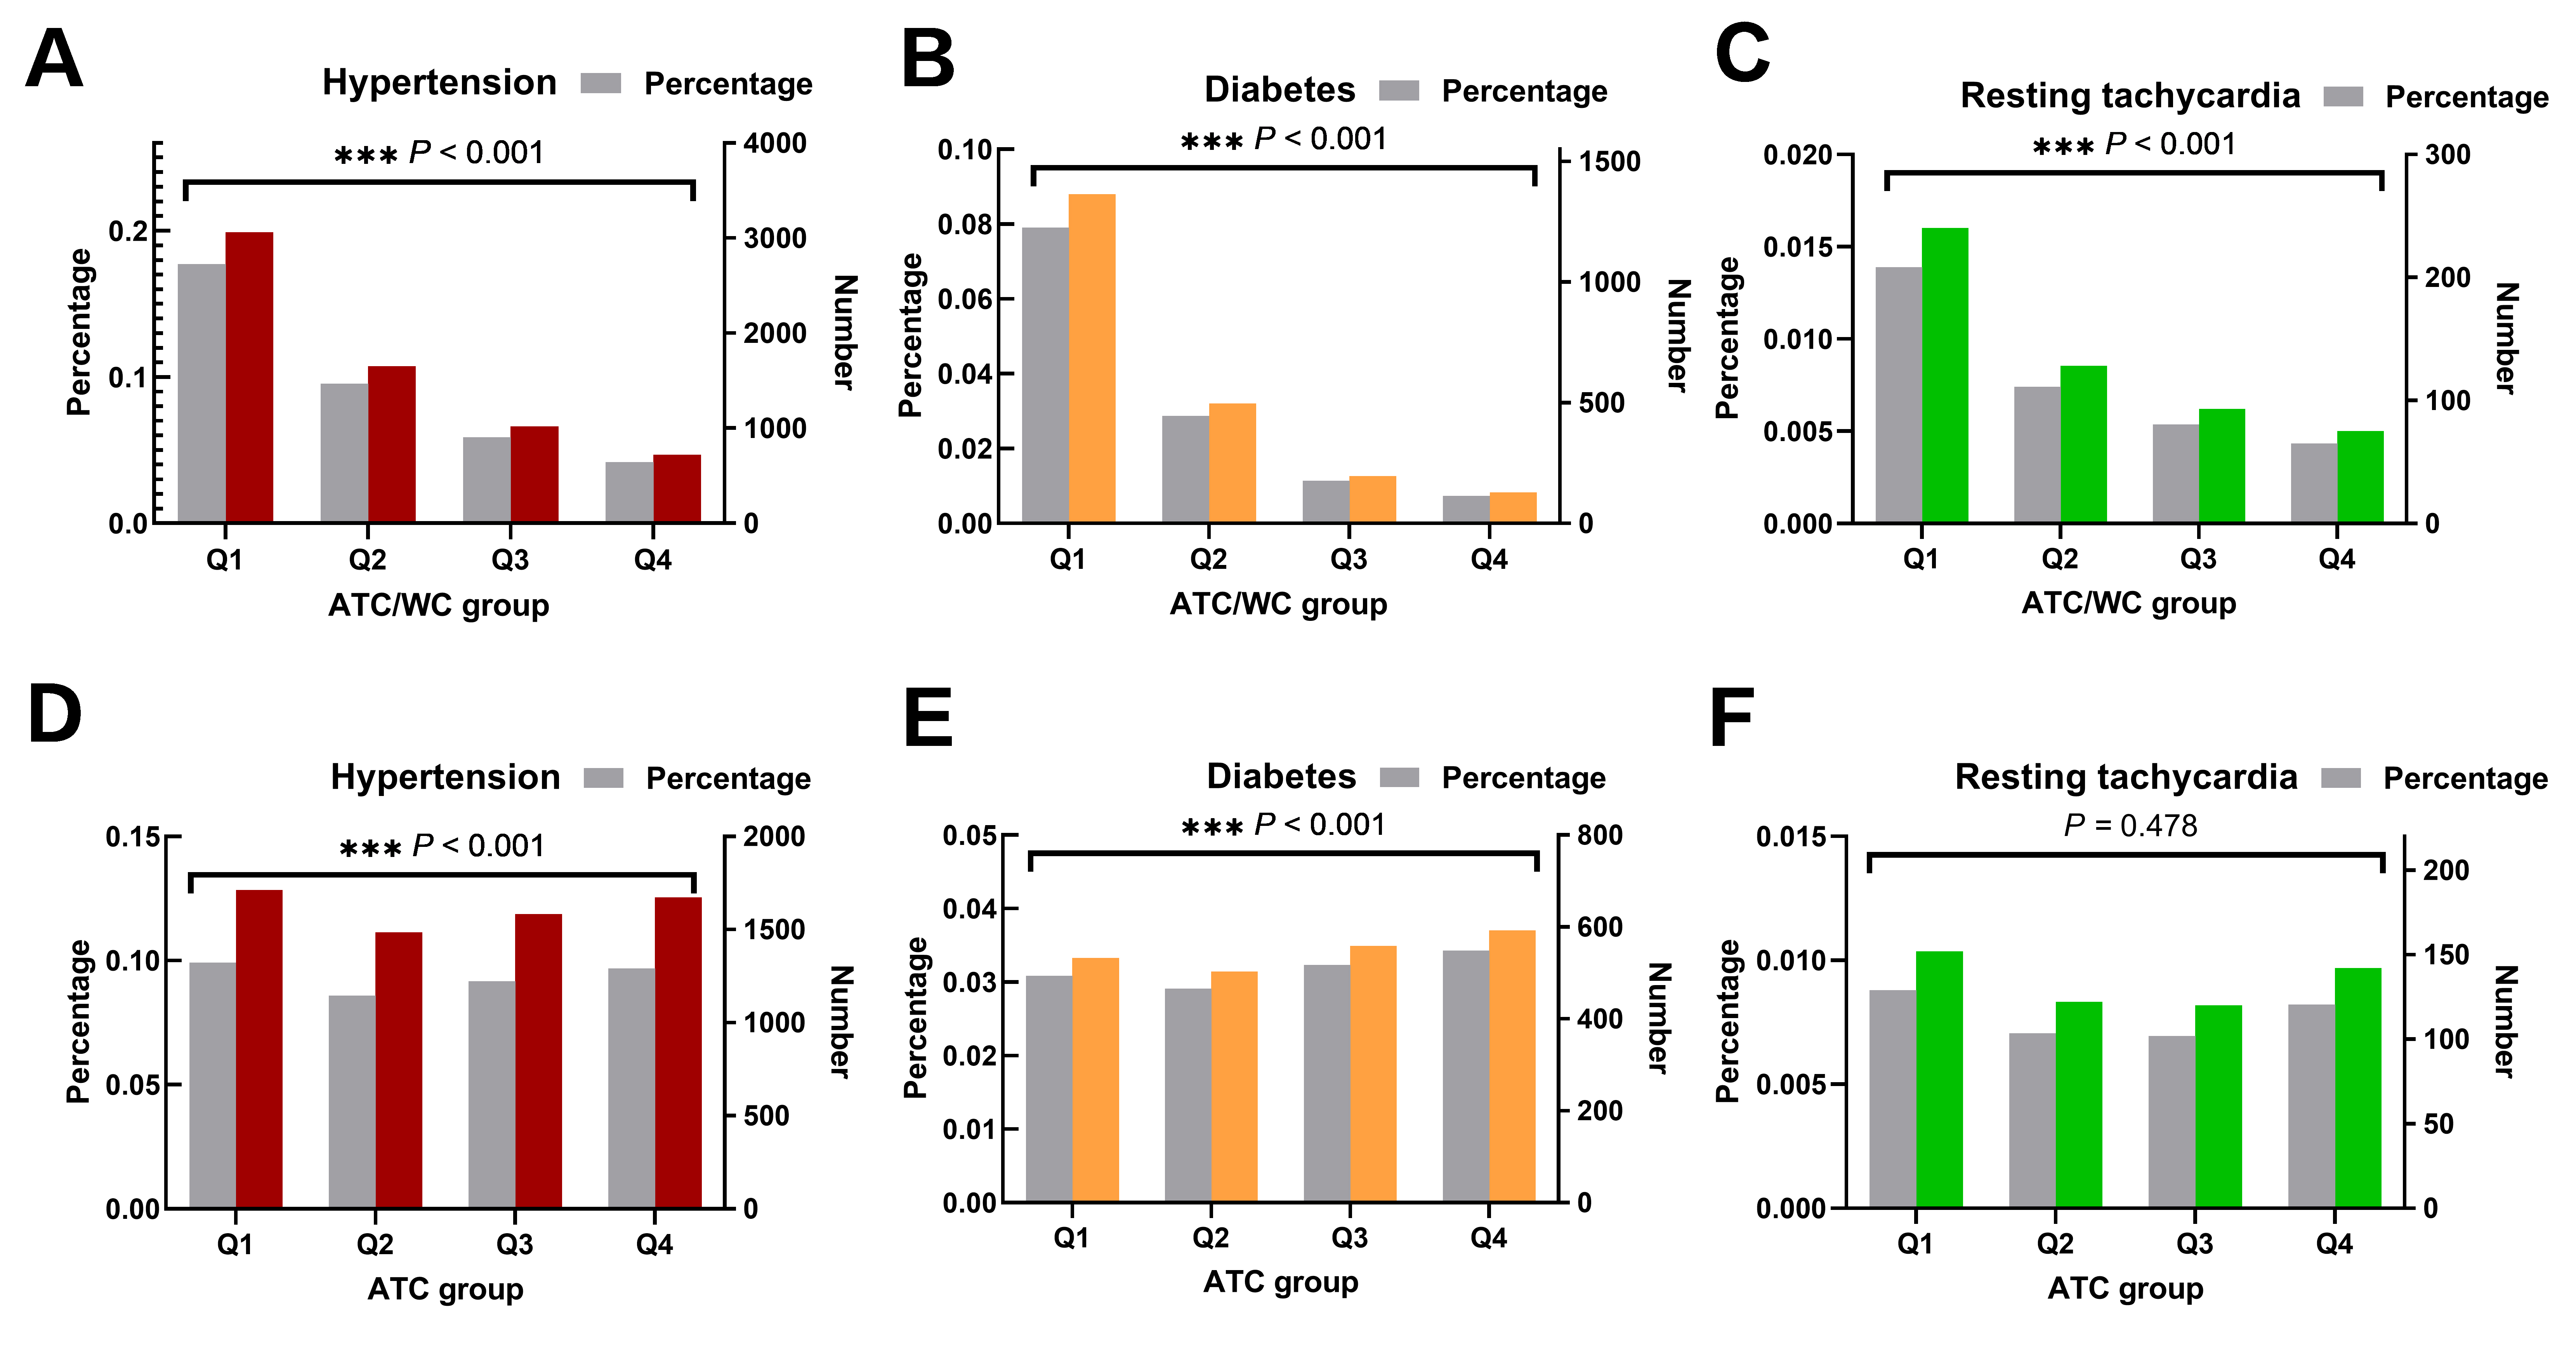
Figure 2. Prevalence of hypertension, diabetes, and resting tachycardia based on ATC/WC and ATC quartile grouping. Group comparisons were performed using the weighted chi-square test. (A) Hypertension weighted prevalence and case number by ATC/WC quartiles. (B) Diabetes weighted prevalence and case number by ATC/WC quartiles. (C) Resting tachycardia weighted prevalence and case number by ATC/WC quartiles. (D) Hypertension weighted prevalence and case number by ATC quartiles. (E) Diabetes weighted prevalence and case number by ATC quartiles. (F) Resting tachycardia weighted prevalence and case number by ATC quartiles.
In logistic regression of model 3, participants in Q4 of ATC/WC had substantially lower odds of hypertension (odds ratio (OR) = 0.36, 95%CI: 0.30-0.42), diabetes (OR = 0.19, 95%CI: 0.13-0.26), and resting tachycardia (OR = 0.25, 95%CI: 0.18-0.37) compared to Q1. Critically, these robust protective associations persisted after further adjustment for BMI in model 4, with ORs of 0.49 (95%CI: 0.41-0.59) for hypertension, 0.26 (95%CI: 0.18-0.37) for diabetes, and 0.28 (95%CI: 0.19-0.39) for resting tachycardia [Table 3], underscoring the ability of ATC/WC to effectively account for adiposity.
Generalized liner regression for ATC/WC, ATC and cardiovascular risk factors
| Characteristics | Model 1a OR (95%CI) | Model 2b OR (95%CI) | Model 3c OR (95%CI) | Model 4d OR (95%CI) | Model 5e OR (95%CI) |
| Hypertension (6,454/17,276) | |||||
| ATC/WC | |||||
| Q1 | Ref | Ref | Ref | Ref | - |
| Q2 | 0.41(0.36-0.46) | 0.60(0.51-0.71) | 0.63(0.54-0.75) | 0.73(0.62-0.86) | - |
| Q3 | 0.24(0.21-0.27) | 0.45(0.40-0.52) | 0.50(0.43-0.57) | 0.63(0.55-0.73) | - |
| Q4 | 0.14(0.12-0.17) | 0.32(0.27-0.38) | 0.36(0.30-0.42) | 0.49(0.41-0.59) | - |
| p for trend | < 0.001* | < 0.001* | < 0.001* | < 0.001* | - |
| ATC | |||||
| Q1 | Ref | Ref | Ref | Ref | Ref |
| Q2 | 1.00 (0.97-1.03) | 1.16 (1.01-1.33) | 1.16 (1.01-1.33) | 0.81 (0.70-0.94) | 0.83 (0.71-0.96) |
| Q3 | 1.04 (1.02-1.06) | 1.65 (1.46-1.86) | 1.60 (1.40-1.82) | 0.81 (0.67-0.98) | 0.86 (0.73-1.02) |
| Q4 | 1.13 (1.10-1.16) | 2.89 (2.53-3.30) | 2.70 (2.37-3.07) | 0.74 (0.59-0.93) | 0.87 (0.71-1.05) |
| p for trend | < 0.001* | < 0.001* | < 0.001* | 0.027* | 0.231 |
| Diabetes (2,187/17,276) | |||||
| ATC/WC | |||||
| Q1 | Ref | Ref | Ref | Ref | - |
| Q2 | 0.33 (0.29-0.39) | 0.41 (0.35-0.49) | 0.43 (0.37-0.52) | 0.51 (0.43-0.61) | - |
| Q3 | 0.13 (0.11-0.16) | 0.20 (0.16-0.25) | 0.22 (0.18-0.28) | 0.29 (0.23-0.36) | - |
| Q4 | 0.09 (0.07-0.11) | 0.16 (0.11-0.23) | 0.19 (0.13-0.26) | 0.26 (0.18-0.37) | - |
| p for trend | < 0.001* | < 0.001* | < 0.001* | < 0.001* | - |
| ATC | |||||
| Q1 | Ref | Ref | Ref | Ref | Ref |
| Q2 | 1.07 (0.89-1.28) | 1.21 (1.02-1.45) | 1.25 (1.04-1.51) | 0.70 (0.56-0.88) | 0.67 (0.54-0.84) |
| Q3 | 1.39 (1.16-1.66) | 1.81 (1.50-2.18) | 1.85 (1.53-2.23) | 0.63 (0.50-0.80) | 0.61 (0.49-0.77) |
| Q4 | 1.84 (1.51-2.24) | 2.96 (2.43-3.62) | 2.95 (2.40-3.62) | 0.34 (0.24-0.48) | 0.35 (0.27-0.47) |
| p for trend | < 0.001* | < 0.001* | < 0.001* | < 0.001* | < 0.001* |
| Resting tachycardia rates (536/17,276) | |||||
| ATC/WC | |||||
| Q1 | Ref | Ref | Ref | Ref | - |
| Q2 | 0.54 (0.39-0.75) | 0.44 (0.32-0.61) | 0.47 (0.34-0.64) | 0.48 (0.35-0.67) | - |
| Q3 | 0.50 (0.36-0.69) | 0.36 (0.26-0.50) | 0.40 (0.28-0.56) | 0.42 (0.30-0.60) | - |
| Q4 | 0.37 (0.27-0.51) | 0.22 (0.15-0.32) | 0.25 (0.18-0.37) | 0.28 (0.19-0.39) | - |
| p for trend | < 0.001* | < 0.001* | < 0.001* | < 0.001* | - |
| ATC | |||||
| Q1 | Ref | Ref | Ref | Ref | Ref |
| Q2 | 0.84 (0.57-1.25) | 0.95 (0.63-1.43) | 0.94 (0.62-1.43) | 0.78 (0.51-1.19) | 0.67 (0.44-1.01) |
| Q3 | 0.64 (0.48-0.86) | 0.78 (0.57-1.05) | 0.75 (0.55-1.03) | 0.52 (0.37-0.75) | 0.39 (0.29-0.54) |
| Q4 | 1.23 (0.84-1.78) | 1.43 (0.97-2.11) | 1.34 (0.91-1.96) | 0.65 (0.37-1.14) | 0.38 (0.23-0.62) |
| p for trend | 0.478 | 0.133 | 0.234 | 0.029* | < 0.001* |
In contrast, the associations for ATC alone were confounded by overall adiposity. Before adjustment for BMI or WC (model 3), a larger ATC (Q4 vs. Q1) was paradoxically associated with higher odds of hypertension (OR = 2.70, 95%CI: 2.37-3.07) and diabetes (OR = 2.95, 95%CI: 2.40-3.62), and showed a non-significant trend for resting tachycardia (OR = 1.23, 95%CI: 0.84-1.78). However, after adjusting for BMI (model 4), these adverse associations were not only eliminated but reversed, revealing significant protective effects for hypertension (OR = 0.74, 95%CI: 0.59-0.93) and diabetes (OR = 0.34, 95%CI: 0.24-0.48), and a non-significant protective trend for tachycardia (OR = 0.65, 95%CI: 0.37-1.14). Sensitivity analyses adjusting for WC yielded consistent results. This pattern unequivocally demonstrates that the true protective association of limb circumference is masked by its correlation with overall adiposity.
For ATC/WC, a linear inverse association was observed for hypertension (p non-linear = 0.89), as shown in Figure 3A, while its relationships with diabetes (p non-linear = 0.004) and resting tachycardia (p non-linear = 0.026) exhibited significant non-linear components, as shown in Figure 3B and C. Protective effects appear when ATC/WC exceeds 0.89. ATC showed a linear correlation with hypertension and a nonlinear correlation with diabetes and resting tachycardia [Supplementary Figure 5].
Figure 3. ATC/WC and hypertension, diabetes, and resting tachycardia. The association was analyzed using a restricted cubic spline model, adjusted for age, sex, race, marital status, education, family income-poverty ratio, BMI, smoking, drinking, creatinine, uACR, hyperlipidemia, and history of underlying diseases. (A) Association between ATC/WC and hypertension. (B) Association between ATC/WC and diabetes. (C) shows the association between ATC/WC and resting tachycardia.
Additional and sensitivity analysis
The robustness of the primary findings and potential underlying mechanisms were evaluated through a set of sensitivity analyses.
First, we confirmed the fundamental source of confounding for ATC by demonstrating its significant, linear positive correlations with both BMI and WC [Supplementary Figure 6]. Consistently, higher ATC was linked to greater odds of both general and abdominal obesity [Supplementary Table 1], directly explaining its paradoxical associations before adiposity adjustment.
The protective associations of ATC/WC with mortality and CVRFs remained consistent across all pre-specified subgroups (stratified by sex, age, hypertension, diabetes, smoking status, and history of underlying diseases; Supplementary Figures 7-10), with generally more pronounced effects in males and older adults. In contrast, the association of ATC with outcomes was modified by certain health conditions, further underscoring its instability without considering central adiposity.
The robustness of the findings was further corroborated using continuous measures of cardiovascular risk. Furthermore, in models with full adjustment, ATC/WC showed significant inverse correlations with systolic and diastolic BP, resting heart rate, and fasting blood glucose, and these associations persisted after additional adjustment for BMI [Supplementary Table 2]. Replicating the pattern seen with dichotomous outcomes, ATC was positively associated with these continuous measures in models unadjusted for BMI, but these associations reversed direction after BMI adjustment.
Finally, deconstructing the composite metrics confirmed the generalizability of the central finding. Both the arm-to-waist (AC/WC) and thigh-to-waist (TC/WC) ratios were significantly inversely associated with all mortality and CVRF outcomes [Supplementary Tables 3-7]. Similarly, the individual circumferences (AC and TC) alone were inversely associated with mortality [Supplementary Tables 8 and 9]. Most critically, for CVRFs, the isolated arm (AC) and thigh (TC) circumferences recapitulated the identical paradoxical pattern observed for ATC: they were positively associated with hypertension, diabetes and resting tachycardia before adiposity adjustment, but these associations were attenuated, nullified, or reversed after controlling for BMI or WC [Supplementary Tables 10-12]. This confirms that the confounding effect of overall adiposity is a universal property of limb circumference measures, which is effectively resolved by forming a ratio with WC.
Collectively, these comprehensive sensitivity analyses solidify the premise that ATC/WC is a robust, adiposity-independent indicator of metabolic health, thereby resolving the confounding that inherently plagues the interpretation of limb circumferences alone.
DISCUSSION
This study demonstrates that the ATC/WC ratio exhibits a significant linear association with both mortality risk and cardiovascular risk. A graded increase in the ATC/WC value corresponds to a progressive decline in the risk of all-cause and cardiovascular mortality. A similarly stepwise reduction is observed in the likelihood of developing multiple CVRFs. This finding reconciles a persistent paradox in the assessment of limb circumference for cardiovascular health: although greater limb circumference (reflected in a higher ATC/WC) is linked to improved survival, it has occasionally been correlated with an elevated burden of CVRFs. The study also reveals that the association between the absolute limb circumference (ATC) and mortality is nonlinear, with a protective intermediate range; both excessively low and excessively high ATC values are linked to an elevated risk of death.
Regarding CVRFs, ATC shows an increasing risk association before adjustment for adiposity, which reverses to a decreasing risk pattern after such adjustment. Furthermore, we confirmed the robustness of these associations using the arm-to-waist (AC/WC) and thigh-to-waist (TC/WC) ratios. By resolving this contradiction and elucidating the true effect of limb circumference, this approach substantially improves cardiovascular risk assessment based on body size and circumference in community healthcare settings.
Our findings consolidate and extend the existing literature. We corroborate numerous studies indicating that larger limb circumferences are associated with reduced mortality (arm[25-30] and thigh[31,32]). Moreover, we successfully replicate and provide a mechanistic explanation for the conflicting reports regarding limb circumference and CVRFs[12-14,33,34]. The apparent positive association between ATC and CVRFs in unadjusted models was largely mediated by its strong correlation with general obesity. After rigorously adjusting for BMI or WC, the true protective effect of ATC on CVRFs was unmasked. This occurs because limb circumference carries dual biological signals: it reflects both beneficial lean mass and the peripheral fat deposition associated with adverse health. The protective signal for mortality is dominant, while its benefit for CVRFs is only unveiled after accounting for confounding adiposity.
This fundamental insight led us to propose ATC/WC as a novel, integrated metric. By normalizing limb size for overall body size, this index simultaneously incorporates information on central adiposity (via WC) and peripheral tissue mass (via ATC), effectively eliminating the confounding influence of adiposity. Across various models, a graded decrease in ATC/WC is consistently linked to a marked decline in mortality from all causes and cardiovascular disease. Conversely, an increase in ATC initially lowers mortality risk but shows a risk rebound starting from the highest quartile (Q4), which clearly demonstrates that it is not an ideal measure for assessing mortality risk.
The ATC/WC ratio requires no complex measurements and does not necessitate separate consideration of adiposity phenotypes. Its stable and consistent inverse association with all endpoints demonstrates its immediate potential for translation into primary care practice. First, it could be seamlessly integrated into routine health check-ups. During standard physical examinations, healthcare providers already measure WC; adding quick, standardized measurements of mid-arm and mid-thigh circumference would incur minimal additional time or cost. Second, this ratio complements existing metrics. While BMI and WC are unable to assess peripheral musculoskeletal mass, ATC/WC quantifies the balance between potentially harmful visceral fat and protective peripheral tissue. Specifically, ATC/WC can identify high-risk normal-weight phenotypes; individuals with a normal BMI but a low ATC/WC might be missed by BMI assessment alone. Finally, this metric is easily understandable for patients, serving as a tangible tool for health education. Explaining that “a healthier body shape involves not just a smaller waist but also maintaining adequate muscle and limb tissue mass” can motivate targeted lifestyle changes focused on nutrition and resistance training to improve body composition. Therefore, the ATC/WC ratio is not merely a research finding but a practical tool that can enhance risk stratification, guide patient communication, and inform personalized prevention strategies in everyday clinical practice.
For health risk assessment using ATC/WC, this study proposes two potential clinical thresholds: ATC/WC < 0.835 suggests elevated mortality risk, and ATC/WC < 0.89 indicates increased CVRF risk. Applying these thresholds suggests that approximately 25% of the U.S. adult population may face higher mortality risk, and nearly 50% have an elevated risk for CVRFs. These findings could inform the development of future public health guidelines.
Our findings are supported by biological plausibility. A high ATC/WC ratio intuitively represents a phenotype of ample peripheral tissue relative to central fat, a balance supported by the functional heterogeneity of adipose tissue and the metabolic benefits of muscle. Visceral fat, proxied by WC, is a well-established driver of insulin resistance and inflammation, promoting CVRFs[35,36]. In contrast, limb tissue predominantly plays a protective role: muscle mass enhances metabolic health[37-39], and limb subcutaneous fat may act as a metabolic sink[38]. Furthermore, adequate limb circumference supports cardiorespiratory function and physical capacity[40-42].
Several limitations should be noted. First, the observational nature of the study limits causal conclusions. Second, the applicability of the proposed thresholds beyond the U.S. population needs confirmation. Additionally, the potential for reverse causality must be carefully considered when interpreting the results. It is plausible that pre-existing cardiometabolic diseases (e.g., heart failure, advanced diabetes, cancer) could lead to cachexia, sarcopenia, or generalized muscle wasting, thereby reducing limb circumference, which might be a primary driver of the observed associations. We have taken several steps to mitigate this concern and maintain that it does not invalidate our main conclusions. First, in the mortality analysis, exposure (limb circumference) was assessed at baseline, and the outcome (death) occurred during follow-up, establishing a temporal sequence. Second, in the primary analysis of CVRFs, we statistically adjusted for a composite history of baseline health status (cardiovascular, renal, and metabolic health) and diseases (including cancer, respiratory diseases, coronary heart disease, heart failure, and stroke) across all models where possible. Third, the persistent strong, linear inverse dose-response relationship of ATC/WC across its full range, rather than a threshold effect confined to extreme values, argues against the associations being driven solely by a small subset of severely ill individuals. Most importantly, the differential findings for ATC and ATC/WC provide internal evidence against reverse causality being the sole explanation. If disease-induced muscle loss were the primary mechanism, both low ATC and low ATC/WC would be expected to correlate with poorer outcomes. However, unadjusted ATC was paradoxically positively associated with higher risks of CVRFs in our data—a pattern that reversed after adjusting for adiposity. This pattern is inconsistent with a simplistic "disease causes low limb circumference" model and instead underscores adiposity as the key confounding factor. Finally, despite adjusting for major confounders, the potential for residual confounding persists. Future studies are needed to validate the independent and joint effects of limb circumference and adiposity using different approaches, thereby addressing gaps in anthropometric knowledge.
In conclusion, we provide a practical solution to the paradox of limb circumference. The ATC/WC ratio effectively integrates and reconciles conflicting signals from body composition into a single, robust, and clinically actionable metric. This simple, low-cost tool holds considerable promise for improving cardiovascular risk assessment and advancing personalized prevention strategies.
DECLARATIONS
Acknowledgments
The authors thank all the NHANES participants and staff members for their contributions to data collection and for making the data publicly available.
Authors’ contributions
Conceptualized the study, curated the data, performed formal analysis, developed the methodology, visualized the data, and wrote the original draft: Zuo S
Curated the data, validated the findings, visualized the data, and contributed to the review and editing of the manuscript: Guo T, Ren H
Validated the data, validated the findings, and contributed to the review and editing of the manuscript: Cao H
Curated the data, conducted investigations, and administered the project: Yang Y, Wang R, Liu C, Zhuo Y, Xia T, Yuan X, Chang M, Hu G, Sun Y, Zhang X, Du M, Jia H, Man Z, Zhang T
Developed the methodology, supervised the research, and contributed to the review and editing of the manuscript: Mu J
Funded the acquisition, developed the methodology, supervised the research, and contributed to the review and editing of the manuscript: Zuo M
All authors have read and approved the final manuscript.
Availability of data and materials
The datasets generated and analyzed during the current study are available in the NHANES repository (https://www.cdc.gov/nchs/nhanes/index.htm). All data can be requested from the corresponding author.
AI and AI-assisted tools statement
Not applicable.
Financial support and sponsorship
This work was supported by the Science and Technology Boosting Program Fund of Yan'an University Xianyang Hospital.
Conflicts of interest
All authors declared that there are no conflicts of interest.
Ethical approval and consent to participate
The study was conducted in accordance with the Declaration of Helsinki. The National Center for Health Statistics (NCHS) Ethics Review Board (ERB) ensures that research involving human participants protects the rights and welfare of study participants and conforms to U.S. federal regulations. The NCHS ERB and the formal review bodies that preceded it have approved each NHANES study protocol since the survey began running continuously in 1999. All participants provided written informed consent. The use of publicly available de-identified data from the NHANES was determined to be exempt from review by the Ethics Committee of Yan'an University Xianyang Hospital.
Consent for publication
Not applicable.
Copyright
© The Author(s) 2026.
Supplementary Materials
REFERENCES
1. Brauer M, Roth GA, Aravkin AY, et al. Global burden and strength of evidence for 88 risk factors in 204 countries and 811 subnational locations, 1990-2021: a systematic analysis for the Global Burden of Disease Study 2021. Lancet. 2024;403:2162-203.
2. Jacobs DR, Woo JG, Sinaiko AR, et al. Childhood cardiovascular risk factors and adult cardiovascular events. N Engl J Med. 2022;386:1877-88.
3. Khan SS, Matsushita K, Sang Y, et al. Development and validation of the American Heart Association’s PREVENT equations. Circulation. 2024;149:430-49.
4. Diogo R, Esteve-Altava B, Smith C, Boughner JC, Rasskin-Gutman D. Anatomical network comparison of human upper and lower, newborn and adult, and normal and abnormal limbs, with notes on development, pathology and limb serial homology vs. homoplasy. PLoS ONE. 2015;10:e0140030.
5. Dunstan DW, Daly RM, Owen N, et al. High-intensity resistance training improves glycemic control in older patients with type 2 diabetes. Diabetes Care. 2002;25:1729-36.
6. Cheng YJ, Gregg EW, De Rekeneire N, et al. Muscle-strengthening activity and its association with insulin sensitivity. Diabetes Care. 2007;30:2264-70.
7. Jayedi A, Soltani S, Zargar MS, Khan TA, Shab-Bidar S. Central fatness and risk of all cause mortality: systematic review and dose-response meta-analysis of 72 prospective cohort studies. BMJ. 2020;370:m3324.
8. Stankute I, Dulskiene V, Kuciene R. Associations between neck circumference, mid-upper arm circumference, wrist circumference, and high blood pressure among lithuanian children and adolescents: a cross-sectional study. Nutrients. 2024;16:677.
9. Liao P, Lin Y, Ting M, et al. Adverse body measurements are superior to sarcopenia-associated measurements in predicting chronic diseases. Sci Rep. 2021;11:7749.
10. Shi R, Gao K, Gao Y, et al. Mid-arm muscle circumference and triceps skinfold thickness associated with cardiometabolic disease in Chinese residents: a prospective cohort study. Nutr Metab Cardiovasc Dis. 2024;34:45-54.
11. Liu Y, Sun G, Li Y. A prospective cohort study on the association of lean body mass estimated by mid‐upper arm muscle circumference with hypertension risk in Chinese residents. J Clin Hypertens. 2022;24:329-38.
12. Jung KJ, Kimm H, Yun JE, Jee SH. Thigh circumference and diabetes: obesity as a potential effect modifier. J Epidemiol. 2013;23:329-36.
13. Liu J, Jin X, Feng Z, Huang J. Using anthropometric parameters to predict insulin resistance among patients without diabetes mellitus. Sci Rep. 2024;14:21407.
14. Zheng Y, Zhang J, Ren Z, et al. Prognostic value of arm circumference for cardiac damage and major adverse cardiovascular events: a friend or a Foe? A 2-year follow-up in the northern Shanghai study. Front Cardiovasc Med. 2022;9:816011.
15. Hendrixson DT, Stephenson KB. To survive, yet not thrive: long-term outcomes of childhood survivors of severe acute malnutrition. Am J Clin Nutr. 2023;118:839-40.
16. Thompson DS, Bourdon C, Massara P, et al. Childhood severe acute malnutrition is associated with metabolic changes in adulthood. JCI Insight. 2020;5:e141316.
17. Filippin LI, Teixeira VNDO, Da Silva MPM, Miraglia F, Da Silva FS. Sarcopenia: a predictor of mortality and the need for early diagnosis and intervention. Aging Clin Exp Res. 2014;27:249-54.
18. Alberti K, Eckel RH, Grundy SM, et al. Harmonizing the metabolic syndrome: a joint interim statement of the international diabetes federation task force on epidemiology and prevention; National Heart, Lung, and Blood Institute; American Heart Association; World Heart Federation; International Atherosclerosis Society; and International Association for the Study of Obesity. Circulation. 2009;120:1640-5.
19. Xiao X, Yu X, Zhu H, et al. Arm circumference, arm-to-waist ratio in relation to cardiovascular and all-cause mortality among patients with diabetes mellitus. Nutrients. 2023;15:961.
20. Kwon HR, Han KA, Ahn HJ, Lee JH, Park GS, Min KW. The correlations between extremity circumferences with total and regional amounts of skeletal muscle and muscle strength in obese women with type 2 diabetes. Diabetes Metab J. 2011;35:374.
21. CDC. NHANES survey methods and analytic guidelines. Available from:https://wwwn.cdc.gov/nchs/nhanes/analyticguidelines.aspx [Last accessed on 15 May 2026].
22. CDC. 2019 public-use linked mortality files. Available from:https://www.cdc.gov/nchs/data/datalinkage/public-use-linked-mortality-file-description.pdf [Last accessed on 15 May 2026].
23. CDC. NHANES August 2021-August 2023 Laboratory Methods. Available from:https://wwwn.cdc.gov/nchs/nhanes/continuousnhanes/labmethods.aspx?Cycle=2021-2023 [Last accessed on 11 May 2026].
24. Brugada J, Katritsis DG, Arbelo E, et al. 2019 ESC Guidelines for the management of patients with supraventricular tachycardia - The Task Force for the management of patients with supraventricular tachycardia of the European Society of Cardiology (ESC): Developed in collaboration with the Association for European Paediatric and Congenital Cardiology (AEPC). Eur Heart J. 2020;41:655-720.
25. Hou X, Hu J, Wang E, et al. The L-shaped association of mid-upper arm circumference with all-cause and cause-specific mortality in US adults: a population-based prospective cohort study. BMC Public Health. 2023;23:2297.
26. Chen Y, Ge W, Parvez F, et al. A prospective study of arm circumference and risk of death in Bangladesh. Int J Epidemiol. 2014;43:1187-96.
27. Shi X, Chai L, Zhang D, Fan J. Association between complementary anthropometric measures and all-cause mortality risk in adults: NHANES 2011-2016. Eur J Clin Nutr. 2024;79:71-8.
28. Li W, Yin H, Chen Y, et al. Associations between adult triceps skinfold thickness and all-cause, cardiovascular and cerebrovascular mortality in NHANES 1999-2010: a retrospective national study. Front Cardiovasc Med. 2022;9:858994.
29. Wu L, Lin Y, Kao T, et al. Mid-arm circumference and all-cause, cardiovascular, and cancer mortality among obese and non-obese US adults: the national health and nutrition examination survey III. Sci Rep. 2017;7:2302.
30. Liu J, Jin X, Feng Z, Huang J. The association of central and extremity circumference with all-cause mortality and cardiovascular mortality: a cohort study. Front Cardiovasc Med. 2023;10:1251619.
31. Heitmann BL, Frederiksen P. Thigh circumference and risk of heart disease and premature death: prospective cohort study. BMJ. 2009;339:b3292.
32. Chen C, Liu L, Huang J, et al. Thigh circumference and risk of all-cause, cardiovascular and cerebrovascular mortality: a cohort study. Risk Manag Healthc Policy. 2020;13:1977-87.
33. Park JS, Cho MH, Ahn CW, Kim KR, Huh KB. The association of insulin resistance and carotid atherosclerosis with thigh and calf circumference in patients with type 2 diabetes. Cardiovasc Diabetol. 2012;11:62.
34. Li F, Chen L. The Association between trajectories of anthropometric variables and risk of diabetes among prediabetic Chinese. Nutrients. 2021;13:4356.
35. Kartheuser AH, Leonard DF, Penninckx F, et al. Waist circumference and waist/hip ratio are better predictive risk factors for mortality and morbidity after colorectal surgery than body mass index and body surface area. Ann Surg. 2013;258:722-30.
36. Lu Y, Liu S, Qiao Y, Li G, Wu Y, Ke C. Waist-to-height ratio, waist circumference, body mass index, waist divided by height 0.5 and the risk of cardiometabolic multimorbidity: a national longitudinal cohort study. Nutr Metab Cardiovasc Dis. 2021;31:2644-51.
37. Snijder MB, Visser M, Dekker JM, et al. Low subcutaneous thigh fat is a risk factor for unfavourable glucose and lipid levels, independently of high abdominal fat. The Health ABC Study. Diabetologia. 2005;48:301-8.
38. Snijder MB, Dekker JM, Visser M, et al. Trunk fat and leg fat have independent and opposite associations with fasting and postload glucose levels. Diabetes Care. 2004;27:372-7.
39. Bianchi L, Ferrucci L, Cherubini A, et al. The predictive value of the EWGSOP definition of sarcopenia: results from the in CHIANTI study. GERONA. 2016;71:259-64.
40. Hu F, Liu H, Liu X, et al. Mid-upper arm circumference as an alternative screening instrument to appendicular skeletal muscle mass index for diagnosing sarcopenia. Clin Interv Aging. 2021;16:1095-104.
41. Kawakami R, Miyachi M, Sawada SS, et al. Cut‐offs for calf circumference as a screening tool for low muscle mass: WASEDA'S Health Study. Geriatr Gerontol Int. 2020;20:943-50.
Cite This Article
How to Cite
Download Citation
Export Citation File:
Type of Import
Tips on Downloading Citation
Citation Manager File Format
Type of Import
Direct Import: When the Direct Import option is selected (the default state), a dialogue box will give you the option to Save or Open the downloaded citation data. Choosing Open will either launch your citation manager or give you a choice of applications with which to use the metadata. The Save option saves the file locally for later use.
Indirect Import: When the Indirect Import option is selected, the metadata is displayed and may be copied and pasted as needed.
About This Article
Copyright

Data & Comments
Data
0


Comments
Comments must be written in English. Spam, offensive content, impersonation, and private information will not be permitted. If any comment is reported and identified as inappropriate content by OAE staff, the comment will be removed without notice. If you have any queries or need any help, please contact us at [email protected].