
A bibliometric review of carbon footprint research

Abstract
With the global concern over climate change, many countries around the world have pledged to achieve carbon peaking and carbon neutrality goals. Carbon footprint (CF) analysis, as an important research method to evaluate carbon emissions, has gained significant traction in the academic community. This study aims to offer a comprehensive overview of this research domain, addressing existing gaps by conducting a bibliometrics analysis. Moreover, social network analysis (SNA) is conducted to uncover the relationships among different countries, authors, and institutions. Co-occurrence analysis of keywords and citation analysis of publications and corresponding references are also conducted to explore the core research topics in this field, including popular CF accounting methods. Results show that there has been growing interest in CF-related research from 2007 to 2022, with increasing amounts of publications, references, authors, and published countries. The most productive journals, countries, authors, and institutions are identified, and the collaboration networks among different academic groups are also analyzed. In addition, sustainability assessment, consumption-based CF accounting, and emission mitigation potential assessment are identified as research hotspots. Specific research topics include CF accounting at national and household scales, as well as for agricultural systems and universities. Life cycle assessment (LCA), input-output analysis (IOA), and Intergovernmental Panel on Climate Change (IPCC) accounting method are the most commonly applied methods in this field. Therefore, the advantages and disadvantages of these methods are specifically summarized and compared. In general, this study can provide comprehensive information for stakeholders interested in the CF-related field.
Keywords
INTRODUCTION
The rapid pace of industrialization has led to a heavy reliance on fossil fuels and material resources for economic growth. Consequently, this dependence has resulted in substantial carbon emissions, increased energy consumption, and ecological challenges. Of particular concern is the issue of global warming, primarily driven by the release of carbon dioxide (CO2) and other greenhouse gases (GHGs). Since the publication of the first Intergovernmental Panel on Climate Change (IPCC) assessment report in 1990, reducing GHG emissions has become a global goal[1]. The United Nations Framework Convention on Climate Change, the Kyoto Protocol, the Copenhagen conference in 2009, and the goal of carbon emission peaking and carbon neutrality demonstrate the international community's relentless efforts to address global warming. How to accurately assess greenhouse gas emissions generated by human activities is a prerequisite for carbon-reduction strategies. In this context, it is urgent to find appropriate research methods to solve the relevant quantitative evaluation of carbon emissions, such as the sources, mechanism, and quantity of the direct and indirect carbon emissions. The carbon footprint (CF) is an effective approach widely recognized to deal with climate change and quantitatively evaluate carbon emissions intensity, which deeply analyzes the sources, process, and mechanism of carbon emissions, and provides a scientific basis for exploring reasonable and effective ways of carbon reduction[2]. The CF derives from the concept of the ecological footprint, which refers to the biologically productive area of land that is required to sustain the existence of a person, region, or nation or that can accommodate the waste emitted by humans[3]. Despite its name, the CF is usually expressed as a measure of weight, as in tons of CO2 or CO2 equivalent per year. Although many scholars have defined the scope of the CF from different research perspectives, there is no unified definition of CF[4]. Hammond[5] defines CF as the weight of carbon released by individuals or activities, so carbon footprint should be changed to "carbon weight" or other related words. The European Union defines CF as the total amount of CO2 and other greenhouse gases emitted during the whole life cycle of a product or service[6]. Hertwich and Peters[7] and Baldo et al. also defined CF as the total amount of CO2 and other GHGs emitted during the supply chain or life cycle of a product[8]. The definition of carbon footprint proposed by Wiedmann and Minx[9] is comprehensive and accurate, but the CF only refers to CO2 emissions according to such definition. Therefore, based on the existing research, the concept of CF should be further defined as the total amount of GHGs emitted during human production and consumption activities, including the direct and indirect carbon emissions related to products or certain activities from the perspective of a full life cycle[9]. Academically, extensive studies on CF have been undertaken with various goals in the past decades, which mainly include the concept connotation, evaluation methods, and specific applications and practices[9-11], and relatively speaking, the specific application and practice of CF is the focus of current research[12,13]. The research scale includes countries, cities/regions, households, and so on[7,14-18], and with the deepening of research, evaluation methods and tools based on LCA and IOA have received widespread attention from scholars, and the effective measurement of CF has been extensively applied to products, enterprises/organizations, or industries[12,19-24]. Academically, studies on the calculation of CF have been conducted at various scales such as national scale, regional/city scale, and household scale. For example, Chen et al. conducted a time-series analysis using IO tables for China’s construction industry and showed that the great majority of emissions are indirect emissions. UNDP reported per capita CF for nations from 1990 to 2004, but only includes GHG emissions from fuel combustion and cement production[25]. The estimate showed India leaving the smallest footprint with 1.2 tons of CO2 and the biggest footprint by the United Arab Emirates (34.1 tons of CO2). Sovacool et al. compared the CFs of 12 metropolitan areas, including Beijing, London, New York, Mexico, etc., by examining emissions related to vehicles, energy used in buildings, industry, agriculture, and waste, and analyzing the impact of the four major factors of per capita income, population density, transportation mode, and power supply on the CF of different countries[26]. Druckman et al. calculated the CF of households in UK from embodied carbon in products and services, direct energy use in households, private cars and aviation based on the quasi-multi-regional input-output (QMRIO) model during the period of 1990-2004, which showed that embodied carbon accounts for the largest proportion, followed by energy use, and finally private cars and aviation, while the increase in living demand was one of the main reasons for the increase in carbon emissions[27]. Due to the extensive attention given to the externalities of environmental issues, the discussion on carbon footprint has gradually risen to the level of national/ regional cooperation[7,15,17]. In addition, some studies combined LCA and IOA to obtain more accurate and comprehensive research results. The Stockholm Environment Institute calculated the CF of UK schools by combining the method of process and input-output analysis, which showed the total CF of all schools in the UK in 2001 was 920,000 tonnes of CO2, accounting for 1.3% of the total carbon emissions of the UK, of which the direct emissions from heating are only 26% and the other three-quarters are Indirect emissions[28].
Although many CF-related studies have been conducted, there is a lack of systematic and comprehensive CF research review articles. This can be reflected in the following three aspects: Firstly, despite a significant increase in the amount of CF-related publications in recent years, there are relatively few review studies on CF research. Secondly, the existing review studies focus on elucidating the methodologies and applications of CF. In this context, it is critical to provide a holistic picture of its theoretical research progress based on bibliometrics. Bibliometric analysis can quantitatively analyze the primary performance of existing literature and exploit the research hotspots so that valuable information can be provided to get current research progress and future research directions. This not only makes the CF-related theoretical framework and knowledge system visualized, but also provides a reference for CF-related research. Based on the research motivation, this paper attempts to answer the following questions: (1) What is the knowledge base of the existing CF-related research? (2) What are the collaboration networks of CF-related literature? (3) What are the main research hotspots and main topics in this field? (4) What are the scopes of application of major methods of CF accounting and their advantages and disadvantages? With the aim of answering the above questions, this paper analyzes the performance of CF-related literature published from 2007 to 2022. The remainder of this study is organized as follows. After the introduction section, detailed methods and data sources are elaborated in Section 2. Section 3 presents the primary performance of CF-related publications, including journals, disciplines, countries/territories, authors, institutions, and keywords. Meanwhile, social network analysis (SNA) is conducted to analyze the collaboration relationships among different countries/territories, authors, and institutions, and the co-occurrence of keywords. Section 4 conducts citation analysis to uncover the main research topics in this field. Section 5 discusses major methods of CF accounting and their advantages and disadvantages. Finally, we draw our conclusion and limitations in Section 6.
METHODS AND DATA SOURCE
Methods
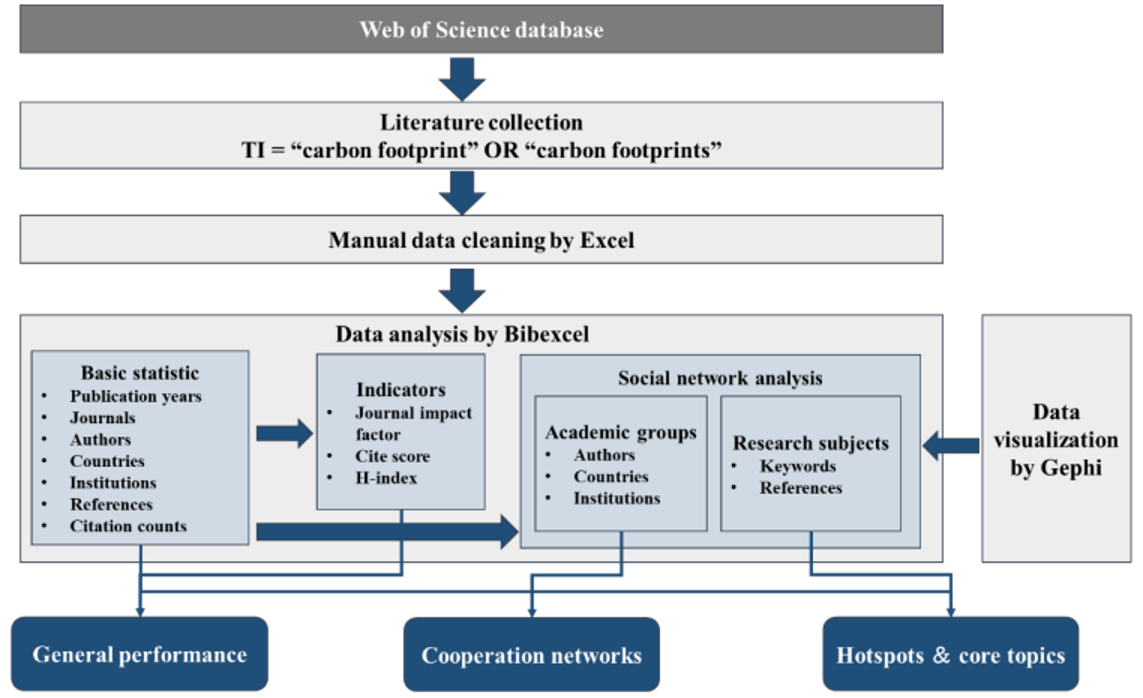
Bibliometric analysis has been widely used to measure the development progress of various research fields since it enables the systematic analysis of massive scientific publications[29-31]. Through such analysis, the influential journals, active countries/authors/institutions, popular keywords, and citation information can be quantitatively analyzed by applying mathematics and statistical methods[32,33]. Therefore, the bibliometric analysis is applied in this study to give a comprehensive insight into the development features and patterns of CF-related research. Detailed data collection, processing, and analysis procedures are shown in Figure 1. Data cleaning is first conducted manually to unify the names of authors, countries, and institutions, to standardize the citation forms of references, and to merge keywords with similar meanings. Then, Bibexcel is used to extract basic statistical information of selected publications. SNA is an effective tool for discovering the relations of various sectors and identifying central actors. In this study, SNA is employed to uncover the academic collaboration among different countries/territories, authors, and institutions. The co-occurrence analysis of the keywords and that of the references of publications are also conducted through SNA. Gephi is used as the visualization tool for SNA. Meanwhile, three indicators, i.e., the journal impact factor (JIF), cite score (CS), and h-index, are adopted. In order to assess the influence of journals, the JIF taken from the Journal Citation Reports 2022 and the CiteScore 2022 calculated by Scopus are used. The JIF is defined as the average number of citations received in a specific year by documents published in the journal in the two preceding years[34]. The CS is calculated as the ratio of the number of received citations over four years to the publication amounts of five types of documents (articles, reviews, conference papers, data papers, and book chapters) in these same four years by a journal[35]. The h-index is another indicator that has attracted wide attention from researchers since it was proposed in 2005[36,37]. The h-index enables the consideration of both quality and quantity by integrating the number of published articles and the citations for individual articles[36,38]. The h-index means that an individual or group has published at least h papers, which are cited at least h times. In this study, the h-indices of countries/territories, authors, and institutions are calculated by Bibexcel and are employed to evaluate the influences of these research groups in the CF-related field.

Figure 1. The flowchart of bibliometric analysis in this study. As shown by the arrows in this Figure, the research hotspots and core research topics in the CF-related field were identified through the co-occurrence analysis of keywords and citation analysis in this study, the latter of which considered both citation counts and co-citation of references.
Data sources
The Web of Science Core Collection (WoSCC), widely used in academia, was selected to search CF-related literature in this study. The WoSCC enables access to multiple databases and provides standardized exporting records[39]. A large number of influential publications in various disciplines are included, although gray literature (e.g., reports and conference proceedings) are not covered. “Carbon footprint” or “carbon footprints” were selected as keywords under the “title” option so that the most relevant publications can be obtained. The time range was set from 2007 to 2022. Further analysis was conducted on the basis of the dataset searched on July 16th, 2023. The initial search found 2,916 papers in total. Among them, articles (2,147 publications) are the major contributions to CF-related research, accounting for approximately 73.63% of the total published papers, followed by proceeding papers (13.72%). Other publications are conference abstracts (3.64%), editorial materials (3.02%), reviews (2.67%), and others (e.g., letters and news items). Since research articles usually provide more original research findings and have relatively complete information on authors and their affiliations, only journal articles published in English were considered for further analysis. After this filtering process, 2,113 papers focusing on CF were exported into plain text format for bibliometric analysis.
RESULTS
Primary performance of selected publications
The numbers of annual publications (AP), the average numbers of references per paper (ARP), the average numbers of authors per paper (AUP), and the published countries (PC) are shown in Figure 2. Based on the growth rate of annual publication amounts, the development of CF-related research can be divided into three stages: slow growth stage, moderate growth stage, and rapid growth stage. In the slow growth stage (2007-2010), the annual publication amount is less than 50, with a total of only 78 papers. In the moderate growth stage (2011-2019), the annual publication amount increased from 58 in 2011 to 192 in 2019, with an annual growth rate ranging from -8.6% to 45.0%. In the rapid growth stage (2020-2022), the annual publication amount increased from 240 in 2020 to 424 in 2022, with an annual growth rate ranging from 25.0% to 32.9%. Meanwhile, the ARP increased from 9.8 in 2007 to 54.6 in 2022, indicating that this research field has become more mature. In addition, the AUP increased from 2.5 in 2007 to 4.7 in 2022, and the PC increased from 3 in 2007 to 67 in 2022, the latter of which were analyzed according to the addresses of authors. Such results show that global interest in CF has increased significantly and the academic collaboration among scholars and countries has been enhanced.

Figure 2. Primary performance of selected publications from 2007 to 2022. ARP represents the average number of references per paper. AUP represents the average number of authors per paper. PC represents the published countries. AP represents the number of annual publications.
Distribution of academic disciplines and journals
According to Web of Science, the selected 2113 publications involved 156 academic disciplines. Table 1 lists the top 10 academic disciplines. Most publications cover 1-3 categories while a few publications cover 4-6 categories, accounting for 96.6% and 3.4% of the total, respectively. This is the reason why the total proportion of publications by categories in Table 1 exceeds 100%. The majority of publications fall within the realms of environmental sciences, green sustainable science technology, and environmental engineering, accounting for 48.9%, 29.8%, and 24.2% of the total, respectively. Of the remaining categories, only environmental studies and energy fuels account for more than 10% of the total. In addition, it is worth noting that 79 papers are involved in the category “economics”, highlighting the emergence of interdisciplinary research.
The top 10 academic disciplines
| # | Academic disciplines | TP | PCT (%) |
| 1 | Environmental Sciences | 1034 | 48.9% |
| 2 | Green Sustainable Science Technology | 629 | 29.8% |
| 3 | Environmental Engineering | 512 | 24.2% |
| 4 | Environmental Studies | 277 | 13.1% |
| 5 | Energy Fuels | 221 | 10.5% |
| 6 | Chemical Engineering | 112 | 5.3% |
| 7 | Economics | 79 | 3.7% |
| 8 | Civil Engineering | 57 | 2.7% |
| 9 | Water Resources | 54 | 2.6% |
| 10 | Food Science Technology | 53 | 2.5% |
The selected 2113 publications were published in 664 journals. Table 2 presents the primary performance of the top 10 productive journals, while the publications by each of the other journals account for less than 1% of the total. These productive journals all encourage interdisciplinary environmental research papers, providing valuable information for sustainable development in environmental, economic, and social aspects. Additionally, Energies and Applied Energy are specialized in the field of energy. Journal of Cleaner Production is the most productive journal, with 321 CF-related papers, whose JIF (11.1) and CS (18.5) are both higher than the average values among these 10 journals. Despite its low JIF (3.9) and CS (5.8), Sustainability is the second most productive journal in the CF-related field, contributing to 121 papers. Other important journals include Science of the Total Environment, International Journal of Life Cycle Assessment, and Environmental Science and Pollution Research, ranking 3rd, 4th, and 5th by their CF-related papers, respectively. In addition, although much fewer related papers were published by Resources Conservation and Recycling and Applied Energy, these two journals rank as the top 2 in terms of JIF and CS. Therefore, the contribution of them in this field should also be confirmed. Due to the interdisciplinary features of CF-related research, it is difficult to determine the most important journal. Nevertheless, these results indeed indicate that several journals including Journal of Cleaner Production, Sustainability, and Science of the Total Environment have made a major contribution to this field.
The primary performance of the top 10 most productive journals
| # | Journal | TP | PCT (%) | JIF | CS |
| 1 | Journal of Cleaner Production | 321 | 15.19 | 11.1 | 18.5 |
| 2 | Sustainability | 121 | 5.73 | 3.9 | 5.8 |
| 3 | Science of the Total Environment | 60 | 2.84 | 9.8 | 16.8 |
| 4 | International Journal of Life Cycle Assessment | 45 | 2.13 | 4.8 | 9.4 |
| 5 | Environmental Science and Pollution Research | 39 | 1.85 | 5.8 | 7.9 |
| 6 | Energies | 33 | 1.56 | 3.2 | 5.5 |
| 7 | Resources Conservation and Recycling | 31 | 1.47 | 13.2 | 20.3 |
| 8 | Applied Energy | 28 | 1.33 | 11.2 | 21.1 |
| 9 | Journal of Environmental Management | 27 | 1.28 | 8.7 | 13.4 |
| 10 | Journal of Industrial Ecology | 25 | 1.18 | 5.9 | 13.0 |
Country/territory, author and institution influences
Academic influences from country/territory, author, and institution perspectives are analyzed so that the characteristics of research groups at three levels can be investigated. Academic performance and cooperative relationships of these research groups are both considered. The information about countries and institutions was derived from the addresses of the authors. Since the author addresses of four publications are unavailable, only 2,109 publications are used in this section.
As described in the method section, SNA is conducted to analyze the cooperative relationships at the country/territory level, author level, and institution level. The size of one node represents the amounts of collaborative partners of one country/territory, author, or institution, while the width of one connecting line between two nodes reflects the collaborative frequency.
Countries/territories
A total of 89 countries were represented in publications in the CF-related field, indicating a global concern on this research topic. Among these countries, 18.4% contributed more than 50 papers, 33.7% contributed 10-50 papers, 31.5% contributed 2-8 papers, and the remaining 16.9% contributed only one paper. Additionally, 613 of these papers were completed through international cooperation. Table 3 presents the primary performance of the top 16 most productive countries/territories, the publications of which are more than 50. China is the most productive country (515 papers), followed by USA (327 papers), which are far ahead of other productive countries such as Spain (186 papers), UK (175 papers), and Italy (130 papers). In addition, USA (57), China (51), UK (43), Australia (39), and Italy (33) are the top five countries with highest h-indices. It is clear that all of the above-mentioned productive and influential countries except China are developed countries since more research institutions are located in these countries.
The primary performance of the top 16 most productive countries/territories
| # | Country | TP | h-index | # | Country | TP | h-index |
| 1 | China | 515 | 51 | 9 | Netherlands | 87 | 28 |
| 2 | USA | 327 | 57 | 10 | Canada | 75 | 25 |
| 3 | Spain | 186 | 32 | 11 | Sweden | 65 | 28 |
| 4 | UK | 175 | 43 | 12 | Brazil | 59 | 19 |
| 5 | Italy | 130 | 33 | 13 | France | 57 | 20 |
| 6 | Germany | 123 | 33 | 14 | Denmark | 54 | 28 |
| 7 | Australia | 116 | 39 | 15 | Finland | 53 | 20 |
| 8 | India | 98 | 24 | 16 | Norway | 51 | 27 |
The top 55 countries with 5 or more publications were selected for collaboration network analysis. These countries were grouped into four clusters, as shown in Figure 3A. Overall, board international cooperation has been carried out in this field. For instance, American countries (e.g., USA and Mexico), Asian countries (e.g., China and Japan), European countries (e.g., UK and Germany), and African countries (e.g., Kenya and Ethiopia) are all grouped into the largest cluster in purple. China, USA, and UK are the three most active countries in international collaboration in the CF-related field. These three countries have collaborated with 39, 40, and 36 of the other 54 countries, respectively. Particularly, the China-USA collaboration (55 papers) contributed the most collaborative publications, followed by the China-Australia collaboration (32 papers) and the China-UK collaboration (23 papers). Such results show that Chinese scholars prefer to collaborate with several specific countries compared to USA, which has a similar number of collaborative publications.

Figure 3. The collaboration networks of the most productive countries/territories (A); authors (B); institutions (C); and the co-occurrence network of the most frequently adopted keywords (D).
Authors
7,425 authors were acknowledged for contributing to this research field, although only 946 authors participated in more than one paper. Table 4 presents the primary performance of the top 16 most productive authors, whose publications range from 8 to 11. Among these authors, 11 authors are from European countries, although 4 of them belong to 2 or 3 countries according to the address of their institutions. For instance, Jukka Heinonen and Edgar Hertwich, the most productive authors, are from Iceland and Norway, respectively, indicating that authors from less productive countries also have excellent performance. From the h-index perspective, the h-indices of seven authors are equal to their publication amounts, while the h-indices of nine authors are lower than their publication amounts, indicating the differences in their academic quality.
The primary performance of the top 16 most productive authors
| # | Author | TP | TC | h-index | # | Author | TP | TC | h-index |
| 1 | Heinonen, Jukka | 11 | 261 | 8 | 9 | Ottelin, Juudit | 9 | 182 | 6 |
| 2 | Hertwich, Edgar | 11 | 1830 | 11 | 10 | Wiedmann, Thomas | 9 | 914 | 9 |
| 3 | Cederberg, Christel | 10 | 773 | 10 | 11 | Geng, Yong | 8 | 468 | 5 |
| 4 | Long, Yin | 10 | 156 | 7 | 12 | Hubacek, Klaus | 8 | 509 | 6 |
| 5 | Wood, Richard | 10 | 1051 | 10 | 13 | Knudsen, Marie Trydeman | 8 | 376 | 8 |
| 6 | Alvarez, Sergio | 9 | 150 | 6 | 14 | Lenzen, Manfred | 8 | 1465 | 7 |
| 7 | Cimini, Alessio | 9 | 95 | 5 | 15 | Lin, Jianyi | 8 | 395 | 8 |
| 8 | Moresi, Mauro | 9 | 95 | 5 | 16 | Vazquez-Rowe, Ian | 8 | 263 | 8 |
The top 69 authors with 5 or more publications were selected for collaboration network analysis. As shown in Figure 3B, three significant academic groups were identified, consisting of 10, 8, and 5 authors, respectively. Centered on the largest cluster in purple, Thomas Widemann from the University of New South Wales is the most collaborative author. He has contributed significantly to CF accounting methodology. In particular, a scientific definition of CF was proposed by him for the first time in 2008, and thus a consensus on the system boundary definition and approach application in such a research field was facilitated[9]. Through collaboration with six other authors in the same group, such as Wiedmann et al., Xu et al. and Wiedmann et al. play a leading role in national and city-level CF accounting research by employing the input-output model[40-42]. The second largest cluster in green is centered by Richard Wood from the Norwegian University of Science and Technology, whose research focus is CF and other environmental pressures (e.g., material, water, and land use) embodied in trade[43]. Additionally, such a cluster is linked with the largest one through Richard Wood and Meng Jing. By comparison, the third cluster in orange is relatively independent, which belongs to authors mostly from Spain with a focus on CF of food production systems by applying life cycle assessment (LCA)[44,45].
Institutions
Table 5 presents the primary performance of the top 10 most productive institutions, with publications ranging from 20 to 70. Among these institutions, 6 institutions belong to China while the remaining 4 belong to different Western countries. Chinese Academy of Sciences is the most productive institution with the largest publication amounts (70 papers) and highest h-index (24), followed by the University of Chinese Academy of Sciences (35 papers) and the Norwegian University of Science and Technology (34 papers). Such results again indicate that great efforts have been made by Chinese scholars in the CF-related field.
The primary performance of the top 15 most productive institutions
| # | Institution | TP | TC | h-index | Country |
| 1 | Chinese Academy of Sciences | 70 | 2370 | 24 | China |
| 2 | University of Chinese Academy of Sciences | 35 | 864 | 16 | China |
| 3 | Norwegian University of Science and Technology | 34 | 2977 | 23 | Norway |
| 4 | China Agricultural University | 33 | 863 | 17 | China |
| 5 | Beijing Normal University | 26 | 847 | 19 | China |
| 6 | Aarhus University | 26 | 1174 | 17 | Denmark |
| 7 | University of Sydney | 25 | 2323 | 19 | Australia |
| 8 | Wageningen University & Research | 23 | 548 | 12 | Netherlands |
| 9 | Tsinghua University | 20 | 725 | 13 | China |
| 10 | Chinese Academy of Agricultural Sciences | 20 | 373 | 11 | China |
The top 56 institutions with 10 or more publications were selected for collaboration network analysis. Chinese Academy of Sciences, University of Chinese Academy of Sciences, and Norwegian University of Science and Technology, which are the top 3 most productive institutions, are also the most collaborative ones [Figure 3C]. They have collaborated with 26, 17, and 16 of the other 55 institutions, respectively. In addition, it is clear that the Chinese Academy of Sciences and the University of Chinese Academy of Sciences are the most active cooperation partners with 33 collaborative publications, followed by other partnerships with collaborative publications ranging from 1 to 7, most of which are located in developed countries. It is suggested that more efforts should be made to enhance collaboration between research institutions in developed countries and those in developing countries so that valuable localized insights can be provided by the local institutions[46].
Analysis of keywords
Since keywords can identify the research focus of one paper, keywords of CF-related publications were analyzed. Among the selected 2,113 publications, 1909 publications have keywords. Some keywords have similar meanings, such as “carbon footprint” and “carbon footprinting”, “life cycle assessment” and “life cycle analysis”, “greenhouse gas emissions” and “greenhouse gas”, and so on. These similar keywords were merged and the singular and plural forms of keywords were unified. After such a treatment, 4810 keywords were finally extracted from 1909 publications for further analysis. 80.8% of these keywords were adopted only once, while keywords that appeared more than three times accounted for 6.0% of the total. The top 16 most frequently adopted keywords are listed in Table 6. The network of the most focused keywords with a frequency of more than 10 is shown in Figure 3D. The size of each node represents the number of co-occurred keywords of each keyword, while the width of each connecting line reflects the co-occurrence frequency between two keywords. These keywords can be categorized into three groups: research purposes, research objects, and research methods.
The top 16 most frequently adopted keywords
| # | Keyword | Frequency | # | Keyword | Frequency |
| 1 | Carbon footprint | 1135 | 9 | Energy consumption | 41 |
| 2 | Life cycle assessment | 424 | 10 | Environmental impact | 40 |
| 3 | Greenhouse gas emissions | 378 | 11 | Global warming | 39 |
| 4 | Carbon emissions | 154 | 12 | China | 36 |
| 5 | Climate change | 148 | 13 | Carbon sequestration | 32 |
| 6 | Sustainability | 83 | 14 | Energy | 29 |
| 7 | Input-output analysis | 58 | 15 | Product carbon footprint | 26 |
| 8 | Global warming potential | 45 | 16 | MRIO analysis | 26 |
Based on the indicators of global warming potentials, CF represents the total quantities of all GHG emissions that have a global warming impact. Therefore, it is not surprising that “carbon footprint” (1135 times), “greenhouse gas emissions” (378 times), “carbon emissions” (154 times), “climate change” (148 times) and “global warming potential” (45 times) rank 1st, 3rd, 4th, 5th and 8th by their frequencies, respectively.
In terms of research purposes, it is clear that CF has been used as an indicator to assess the environmental sustainability of a system. For instance, Clarke et al. evaluated the sustainability of the UK waste management system by calculating the CF of different management options[47]. In particular, it has been suggested that CF and other footprints, such as water, ecological, and energy footprint, should be integrated into an overall evaluation framework[48]. Such a framework can help provide a comprehensive view of the environmental impacts associated with natural resource use and waste discharge. Such research hotspots can also be derived from the co-occurrence results shown in Figure 3D. For instance, the co-occurrence frequency of “carbon footprint” and “water footprint” is 20. For case studies, CF has been widely used as a quantitative tool to assess the emission mitigation potential of diverse strategies, such as material efficiency strategies[49], energy efficiency strategies[50], biogas energy systems[51], etc. In addition, a few studies evaluated the performance of circular economy promotion by investigating CF[52].
In terms of research objects, product CF has been the mainstream issue compared to other micro entities, such as enterprises and individuals. For specific products, energy products (e.g., biofuel)[53] and agricultural products (e.g., crops and livestock)[54,55] have attracted much attention, the latter of which should place greater emphasis on GHG emissions mitigation by soil carbon sequestration. While the research of product CF is becoming systematic and mature, more efforts should be made to fill research gaps regarding corporate CF, especially inconsistent public disclosure and commonly overlooked scope 3 emissions, i.e., the indirect emissions induced by up- and downstream activities along the value chain[56,57]. For macro entities, CF analysis has been carried out at national, regional, city, and household scales[58,59]. It is worth noting that the frequency of “China” is much higher than those of other countries. The main reason is that as the world’s largest carbon emitter, China has adopted many policies and measures to tackle climate change. Under such contexts, adequate research funds have been provided to support relevant studies, among which CF is a key research field.
In terms of research methods, LCA has become the preferred tool of CF accounting because it can provide valuable insights to different stakeholders involved in each life cycle stage of a product. Time series analysis shows that the frequency of “life cycle assessment” increased from 2 in 2009 to 79 in 2022, resulting in its frequency ranking 2nd after “carbon footprint”. Input-output analysis is another popular accounting method. Co-occurrence analysis shows that multi-regional input-output (MRIO) models have been widely applied for consumption-based accounting, which can help uncover carbon emission transfer through interregional or international trade[60].
CITATION ANALYSIS
Two kinds of information, i.e., citation counts and references, are both considered for citation analysis to provide a comprehensive analysis[61]. Citation counts refer to the number of citations a publication has received so that those influential ones can be identified. References of the selected 2113 publications were retrieved to conduct a co-citation analysis. Since the frequent co-cited references have similar subjects, the core research topics in the CF-related field can be identified[62].
Most cited publications
The total citation is an effective indicator to measure the academic value of a paper. Our results show that the total citations of the top 100 most cited publications range from 94 to 1,051, totaling 19,440. Among these publications, the papers published in 2014 and earlier contributed 71.5% of the total number of citations. It makes sense that the papers published in the last few years received fewer citations than those published in the early years, since the former have not received much attention within a relatively shorter time. However, the total citations of some valuable newly published papers will continue to increase. Therefore, the top 11 most cited publications were identified based on their average citation per year (TC/Y), rather than their total citations. As shown in Table 7, there is an obvious gap between the TC/Y and total citations of publications. For instance, the paper published by Hertwich and Peters[7] in Environmental Science & Technology in 2009 has the highest total citation. This paper has received wide attention since it is the first one to quantify and compare the CF of different countries. However, this paper is not as frequently cited as the more recently published papers by Liao et al.[63], Lenzen et al.[64], and Zheng and Suh[65]. These three papers rank 1st, 2nd, and 3rd by their TC/Y, respectively.
The characteristics of the top 11 most frequently cited publications
| # | Author | Year | Journal | TC/Y | TC | Reference |
| 1 | Liao et al. | 2020 | Science | 108.8 | 435 | [63] |
| 2 | Lenzen et al. | 2018 | Nature Climate Change | 104.2 | 625 | [64] |
| 3 | Zheng and Suh | 2019 | Nature Climate Change | 83.4 | 417 | [65] |
| 4 | Hertwich and Peters | 2009 | Environmental Science & Technology | 70.1 | 1051 | [7] |
| 5 | Benjaafar et al. | 2013 | IEEE Transactions on Automation Science and Engineering | 67.5 | 743 | [66] |
| 6 | Tennison et al. | 2021 | The Lancet Planetary Health | 47.7 | 143 | [67] |
| 7 | Bello et al. | 2018 | Journal of Environmental Management | 42.5 | 255 | [68] |
| 8 | Wiedenhofer et al. | 2017 | Nature Climate Change | 39 | 273 | [69] |
| 9 | Hua et al. | 2011 | International Journal of Production Economics | 36.8 | 478 | [70] |
| 10 | Malik et al. | 2018 | The Lancet Planetary Health | 34 | 204 | [71] |
| 11 | Pichler et al. | 2019 | Environmental Research Letters | 34 | 170 | [72] |
More specifically, titled “A sustainable wood biorefinery for low-carbon footprint chemicals production”, the paper with the highest TC/Y (108.8) was published in Science in 2020. This paper developed a sustainable biorefinery that converted wood into useful chemicals such as phenol and propylene by considering both cost and environmental competitiveness. The results of techno-economic analysis and life cycle assessment show that the proposed production process is not only profitable, but also has a lower CF than that of fossil-based production. Titled “The carbon footprint of global tourism”, the paper with the second highest TC/Y (104.2) was published in Nature Climate Change in 2018. This paper quantified embodied carbon flows between different countries driven by global tourism from both residence-based accounting and destination-based accounting perspectives. The carbon burden faced by tourist destination countries and the growing importance of global tourism-related emissions were highlighted in this paper. Titled “Strategies to reduce the global carbon footprint of plastics”, the paper with the third highest TC/Y (83.4) was published in Nature Climate Change in 2019. This paper assessed the global life-cycle GHG emissions of plastics under various mitigation strategies. The results show that four strategies, namely bio-based plastics, renewable energy, recycling, and demand management, need to be combined for global GHG emissions mitigation from plastics. The research topics of these three papers reflect that sustainability assessment, consumption-based CF accounting, and assessment of GHG emission mitigation potential are hotspots in CF-related studies. In addition, other most cited papers reflect the focus on service sectors (e.g., the healthcare sectors[67,71,72]) and the impact of corporate management strategies on CF (e.g., supply chain management[66] and inventory management[70]).
Co-citation and topical analysis
1,156 references with total citations greater than 5 were used for co-citation analysis. Due to the large amount of references, only the references that were co-cited more than 10 times were finally visualized for network analysis so that all the significant connections can be presented, as shown in Figure 4. The size of each node represents the number of co-cited papers for each paper, while the width of each connecting line reflects the co-cited frequency between two papers. It is clear that 4 major clusters were identified, representing different research topics. Table 8 lists the top 5 most-cited references in each cluster.

Figure 4. The topical clusters of most commonly co-cited references.
The top 5 key references in each cluster
| # | Cluster 1 | Cluster 2 | Cluster 3 | Cluster 4 |
| 1 | Hertwich and Peters[7] (2009) | Lal[74] (2004) | Minx et al.[79] (2013) | Larsen et al.[83] (2013) |
| 2 | Wiedmann and Minx[9] (2008) | Cheng et al.[75] (2011) | Wiedenhofer et al.[69] (2017) | Ozawa-Meida et al.[84] (2013) |
| 3 | Weber and Matthews[2] (2008) | Hillier et al.[76] (2009) | Baiocchi et al.[80] (2010) | Alvarez et al.[85] (2014) |
| 4 | Minx et al.[73] (2009) | Yan et al.[77] (2015) | Jones and Kammen[81] (2014) | Thurston and Eckelman[86] (2011) |
| 5 | Druckman and Jackson[28] (2009) | Gan et al.[78] (2014) | Ivanova et al.[82] (2016) | Robinson et al.[87] (2018) |
Cluster 1 is the largest one, with 35 papers. The research topic of this cluster is mainly focused on consumption-based CF at national and household scales. MRIO models were commonly applied by such studies so that the global supply chain can be linked to local consumption activities. Relevant studies quantified carbon leakage due to international trade, thus providing valuable insight into the equitable allocation of carbon emission responsibility between producers and consumers. In addition, household-scale studies in cluster 1 uncovered the impact of income level and consumption structure on household CF. In this regard, cluster 3 has a similar research topic, so its connection with cluster 1 is relatively close. Cluster 3 consists of 17 papers, focusing on the impact of consumer behavior and socio-economic factors (e.g., income, household size, and car ownership) on the household CF. By investigating the CF of households with different socioeconomic and demographic characteristics, relevant studies can provide policy implications for local governments to establish carbon management strategies for different populations. Cluster 2 has the second most papers (30 papers), with its research topic focusing on the CF of agricultural systems. Direct and indirect emissions are both considered in such studies, of which the former is attributed to fertilizer application and mechanical operations (e.g., tillage and irrigation), while the latter is attributed to agrochemical manufacture (e.g., fertilizers and pesticides). Therefore, these studies can help identify key options for reducing agricultural GHG emissions, thus promoting sustainable management of agricultural systems. Cluster 4 has the fewest papers (10 papers), indicating that its research area has received less attention. Its research topic is the CF of universities, covering various university activities, including building energy use, travel, and procurement of goods and services. Relevant studies can help identify the opportunities for GHG mitigation in universities so that proper decisions regarding sustainable development can be made by campus administrators.
MAJOR METHODS OF CARBON FOOTPRINT CALCULATION
The methodological frameworks of CF calculation have been developed over a long period of time[88]. There are various ways to calculate the CF, and the commonly used methods for CF calculation are life-cycle assessment (LCA), input–output analysis (IOA), and Intergovernmental Panel on Climate Change (IPCC) accounting method, especially LCA and IOA methods for calculating CF are more applied.
Life cycle analysis
CF calculation methods are mainly derived from the principle of life cycle assessment, for example, the CF of a product is a necessary byproduct of any life-cycle assessment[89], which is the most widely used method so far. LCA is a method to calculate the potential effects of all inputs and outputs on the environment of specific products, services, processes, or activities throughout their life cycle, which is based on the whole process analysis from cradle to tomb. ISO has formulated the ISO 14040 standard, which divides the LCA implementation steps into four parts: goal and scope definition, inventory analysis, impact assessment, and result interpretation. The International Organization for Standardization (ISO) produced a series of LCA Standards[90-93] focusing on the technical and organizational aspects of an LCA project, and some countries have developed their own GHG accounting guidelines. The LCA calculation process provides sufficient guidance for product development and optimization, strategic planning, public policy formulation, market development, and so on.
At present, a large amount of literature analyzes the CF of micro entities and processes such as industrial processes, transportation, buildings, water supply systems, medical and health care, etc. based on LCA[94-97]. For example, Li et al. investigated precast concrete pile products and their CF from three sources at the construction stage based on the LCA method, which are material transportation, construction equipment, and office area, and the carbon emissions of construction machinery reached 73% of the total carbon emissions[98]. Raeanne Clabeaux presented a streamlined LCA approach to assess the CF of a university campus, and GHG sources presented in this CF include steam generation, refrigerants, electricity generation, electricity life cycle, various forms of transportation, wastewater treatment, and paper usage. Scope 1 emissions accounted for about 19% of the CF, while Scope 2 and 3 emissions each contributed nearly 41% to the CF[99]. Gamage(2008) compared the CF of two different types of office seats based on the LCA method, and found that the seat containing aluminum in the raw material had a higher greenhouse effect coefficient[100].Quanwei Chen investigated CF and carbon reduction potential using a cradle-to-cradle LCA approach on lithium-ion batteries for electric vehicles in China, and reached the conclusion that battery recycling is a short-term carbon reduction measure, and the long-term carbon reduction measure is the greening of electricity[101].
LCA for CF measurement is a down-top method; the emission sources are broken down into different categories for convenient quantification. It is suitable for the calculation of CF at the micro level, which mainly focuses on specific products and services so far, and the calculation process is detailed and accurate, but it becomes too complex for large firms that cover more than second-order emissions, thus underestimating the actual footprint[9,102]. It is very useful for improving the identification of areas of process. However, the collection of data will seriously affect the calculation results, especially since the collection of original data is not always convenient, efficient, and timely. The use of secondary data in the case of unavailability of original data will affect the credibility of calculation results. Moreover, the determination of life cycle stages and the determination of boundaries are complex and difficult. System integrity is often poor due to boundary restrictions. For the analysis of raw materials, product supply chain and retail are not in-depth, such as the carbon emissions of retail cannot be obtained directly, which can only use the sample mean instead.
Input-output analysis
Although the process-based life cycle analysis has been widely concerned so far, it requires different assessment methods for other applied studies of CF. With its focus on direct and indirect carbon emissions of specific economic activities, CF can be clearly and intuitively displayed for input-output (IO) practitioners[33,103]. The methodological framework for IOA was formulated in 1936[104] and enriched in the 1970s[105]. Based on the calculation outcomes of input-output tables, IOA reflects the relationships among initial inputs, intermediate inputs, total inputs, intermediate products, final products, and total outputs by balance equations, which make the source and destination of each flow clear, and show the interdependence of various production activities and economic agents[106,107]. The input-output analysis of CF in the literature began in the late 1980s and has grown rapidly in the past 14 years[103]. The economic Input-output-life cycle assessment model (EIO-LCA) was put forward by Matthews in 2008, which can be used to evaluate the CF of industrial sectors, enterprises, households, government organizations, and so on[4].
At present, many scholars have applied I-O method to calculate carbon footprint. According to the different trade types between the research object and the surrounding areas, the I-O method can be divided into unilateral I-O model (single-region I-O,SRIO), bilateral I-O model (two-region I-O,TRIO) and multilateral I-O model (multi-region I-O,MRIO)[27,108-109]. For example, Hertwich et al. calculated the CF of 73 countries and 13 regions at the national scale based on the MRIO model, and found that the CF of each country differed significantly. Globally, 72% of the CF was due to household consumption, while investment and government consumption were 18% and 10%, respectively. The CF of developed countries focused more on transportation and product production, while the carbon footprint of developing countries was more inclined to food and service[7]. Herrmann calculated the CF of trade between developed countries and newly industrialized economies based on IOA, and showed that production transfer from developed countries to newly industrialized countries was a win-win situation[110].
As a top-down calculation method, IOA mainly measures carbon emissions of certain sectors or industries at meso and macro scales. Using the information provided by the input-output tables, IOA calculates the direct and indirect impact on the environment caused by economic changes, which can transform the complex economic relationship between production sectors or regions into the physical relationship of GHG emissions. With the advantages of clear principles and process, IOA can reflect the exchange process of emissions, thus making the direct and indirect emission relationship clear[103,111,112], and the influence of different factors on carbon emissions can be calculated[113]. Another advantage is that the calculation process lacks detailed details; once the model is established, it makes less effort to calculate, and most of the data are required to be secondary data, which effectively reduces the workload.
The IOA accounting also has two disadvantages: one is that the evaluation data mainly use the average carbon emissions data, while the values of the life cycle CF of the economic subjects are not completely the same, so it is easy to make errors when using average method to process data; the other one is that the boundary of the system is inseparable, and the data obtained are only industrial data, which can only be used to evaluate the CF of a certain department or industry, so it is impossible to conduct effective micro research on the CF of different links and products.
IPCC calculation method
The IPCC calculation method refers to 2006 IPCC guidelines for National Greenhouse Gas inventories prepared by the United Nations Committee on Climate Change, which provides a detailed method for calculating GHG emissions and has become an internationally recognized carbon emissions assessment method. The 2006 IPCC guidelines classified all anthropogenic sources of GHG emissions into four sectors-energy, industrial process and product use, agriculture, forestry and other land use, and waste. According to IPCC, the calculation method of CF is not identical for different departments, but the easiest and most commonly used method is that carbon emissions is equal to the activity data times the activity factor. Due to the difference in the production process, regional distribution, and the technical level, the activity factor is often different in different regions. IPCC gives various default emission factors for different production processes and different countries, and the default emission factors provided by IPCC can be directly adopted in the absence of relevant data[114,115].
The advantage of the IPCC calculation method is that it considers almost all GHG emissions of Scope 1 and Scope 2 in detail and comprehensively, and provides specific emission principles and calculation methods. However, its disadvantage is that it is only applicable to the study of the CF of the closed island system, and the direct carbon footprint in the study area is calculated from the perspective of production, but the embodied carbon emissions cannot be calculated from the perspective of consumption[93,94].
CONCLUSIONS
With the growing international consensus on carbon peaking and carbon neutrality targets, CF-related research has attracted wide attention all over the world. Based on the life cycle theory, the CF can be applied as a quantitative tool to assess the GHG emissions of the entire process on the macro, meso, and micro scales, in which the spatial and temporal perspectives can be both considered. Lots of studies on CF evaluation have been conducted, so it is critical to provide an overview of the research progress. Based on the bibliometrics and knowledge graph, we conduct a systematic literature review to uncover the primary performance of CF–related publications, identify the research focus, and provide useful information to researchers. In order to summarize the existing research outcomes and visually categorize the development trend of future research, this paper reviews 2113 CF-related articles published from 2007 to 2022 using Bibexcel and Gephi softwares. This paper reaches the following conclusions:
By using the Web of Science Core Collection database, 2113 articles were collected for analysis. Overall, the number of annual publications, the average number of references and authors per paper, and the published countries all increased during 2007-2022, reflecting a growing interest in this field. For specific academic disciplines, most of these papers focus on the fields of environmental sciences, green sustainable science technology, and environmental engineering. Additionally, Journal of Cleaner Production, Sustainability, and Science of the Total Environment are the most productive journals in the CF-related field. Furthermore, the academic performance of three academic groups, i.e., countries/territories, authors, and institutions, was assessed. Results show that China and USA are the most influential countries with the largest number of publications and highest h-indices. These two countries are also the most active ones in international collaboration in this field. However, from the perspective of authors, the majority of the most productive authors are from European countries such as Iceland and Norway, indicating that authors from less productive countries also have made a significant contribution in this field. From the perspective of institutions, the Chinese Academy of Sciences is the most productive and collaborative institution, followed by the University of Chinese Academy of Sciences and the Norwegian University of Science and Technology.
In order to identify research hotspots, keyword analysis and citation analysis were conducted, the latter considering both citation counts and co-citations of references. Relevant results show that sustainability assessment, consumption-based CF accounting, and emission mitigation potential assessment are research hotspots in this field. In addition, according to the four main clusters identified by co-citation analysis, specific research topics that have received the most attention include consumption-based CF accounting at national and household scales, as well as for agricultural systems and universities.
In terms of research methods, LCA, input-output analysis and IPCC accounting method are the most commonly applied methods. LCA is a process-based life cycle analysis mainly focused on specific products and services so far, which is a down-top method and suitable for the calculation of CF at the micro scale. IOA is a top-down calculation method, which mainly measures GHG emissions of certain sectors or industries at meso and macro scales. IOA can reflect the exchange process of emissions, thus making the direct and indirect emission relationship clear. The IPCC calculation method considers almost all GHG emissions of Scope 1 and Scope 2 in detail and comprehensively, which is suitable for the CF calculation of closed island systems from the perspective of production.
In general, this study provides a holistic view of CF-related studies, covering the development trend of research, active research groups, research hotspots, application of research methods, etc. Therefore, the results of this study can help researchers in this field to identify future research directions and find suitable scholars or institutions for collaboration. Furthermore, valuable information can be provided for decision makers to increase investment in research & development activities to address practical challenges (e.g., incomprehensive corporate CF accounting standards) and popularize promising emission mitigation projects (e.g., biorefineries). However, some limitations still exist. Firstly, although the most relevant publications with titles including “carbon footprint(s)” were selected for bibliometric analysis in this study, some relevant publications that only include this term in their abstracts or keywords could not be captured under such query option of “title”. Some excellent publications that are not in English or are not articles were not considered for analysis as well. Secondly, detailed information on the development trend of research hotspots cannot be provided because the time series analysis of keywords and research topics was not conducted in this study. These limitations should be addressed by future studies.
DECLARATIONS
Authors’ contributions
Made substantial contributions to the conception and design of the study and writing: Dong Q
Performed data analysis and writing: Zhong C
Performed proof-reading and formal analysis, as well as providing administrative support: Geng Y, Dong F
Performed technical and material support: Chen W, Zhang Y
Availability of data and materials
Not applicable.
Financial support and sponsorship
This study is supported by the Natural Science Foundation of Inner Mongolia Autonomous Region (Grant No. 2023QN07013); the Natural Science Foundation of China (Grant No. 71810107001, 2019YFC1908500,72004125); Education Department of Shandong Province (Grant No. 2022RW063); and China Postdoctoral Science Foundation (Grant No. 2023M732228).
Conflicts of interest
Both authors declared that there are no conflicts of interest.
Ethical approval and consent to participate
Not applicable.
Consent for publication
Not applicable.
Copyright
© The Author(s) 2024.
REFERENCES
1. Ali Y, Pretaroli R, Socci C, Severini F. Carbon and water footprint accounts of Italy: a multi-region input-output approach. Renew Sust Energ Rev 2018;81:1813-24.
2. Weber CL, Matthews HS. Quantifying the global and distributional aspects of American household carbon footprint. Ecol Econ 2008;66:379-91.
3. Wackernagel M, Rees W E. Our ecological footprint: reducing human impact on the earth. New Catalyst Books; 1996.
4. Matthews HS, Hendrickson CT, Weber CL. The importance of carbon footprint estimation boundaries. Environ Sci Technol 2008;42:5839-42.
6. European Commission. Harmonised rules for the calculation of the carbon footprint of electric vehicle batteries (CFB-EV). Available from: https://eplca.jrc.ec.europa.eu/GRB-CBF_CarbonFootprintRules-EV.pdf [Last accessed on 15 Dec 2023].
7. Hertwich EG, Peters GP. Carbon footprint of nations: a global, trade-linked analysis. Environ Sci Technol 2009;43:6414-20.
8. Baldo GL, Marino M, Montani M, Ryding S. The carbon footprint measurement toolkit for the EU Ecolabel. Int J Life Cycle Assess 2009;14:591-6.
9. Wiedmann T, Minx J. A definition of ‘carbon footprint’. Available from: https://www.researchgate.net/publication/247152314_A_Definition_of_Carbon_Footprint [Last accessed on 15 Dec 2023].
10. Carbon Trust. Carbon footprint measurement methodology. Available from: https://semspub.epa.gov/work/09/1142519.pdf [Last accessed on 15 Dec 2023].
11. Almutairi K, Hosseini Dehshiri SS, Hosseini Dehshiri SJ, Mostafaeipour A, Jahangiri M, Techato K. Technical, economic, carbon footprint assessment, and prioritizing stations for hydrogen production using wind energy: a case study. Energy Strategy Reviews 2021;36:100684.
12. Malmodin J, Lundén D. The energy and carbon footprint of the global ICT and E&M sectors 2010-2015. Sustainability 2018;10:3027.
13. Zhang D, Shen J, Zhang F, Li Y, Zhang W. Carbon footprint of grain production in China. Sci Rep 2017;7:4126.
14. Brown MA, Southworth F, Sarzynski A. The geography of metropolitan carbon footprints. Policy Soc 2009;27:285-304.
15. Peters GP, Minx JC, Weber CL, Edenhofer O. Growth in emission transfers via international trade from 1990 to 2008. Proc Natl Acad Sci USA 2011;108:8903-8.
16. Pottier A. Expenditure elasticity and income elasticity of GHG emissions: a survey of literature on household carbon footprint. Ecol Econ 2022;192:107251.
17. Ivanova D, Vita G, Steen-olsen K, et al. Mapping the carbon footprint of EU regions. Environ Res Lett 2017;12:054013.
18. Lee J, Taherzadeh O, Kanemoto K. The scale and drivers of carbon footprints in households, cities and regions across India. Global Environ Chang 2021;66:102205.
19. Burnham A, Wang MQ, Wu Y. Development and applications of GREET 2.7-the transportation vehicle-cyclemodel. Available from: https://publications.anl.gov/anlpubs/2006/12/58024.pdf [Last accessed on 15 Dec 2023].
20. Cole A. More treatment in surgeries and at home will help cut NHS carbon footprint. BMJ 2009;338:b345.
21. Zhang Z, Li J, Guan D. Value chain carbon footprints of Chinese listed companies. Nat Commun 2023;14:2794.
22. Gao T, Jin P, Song D, Chen B. Tracking the carbon footprint of China's coal-fired power system. Resour Conserv Recy 2022;177:105964.
23. Li P, Xia X, Guo J. A review of the life cycle carbon footprint of electric vehicle batteries. Sep Purif Technol 2022;296:121389.
24. Valls-Val K, Bovea MD. Carbon footprint in Higher Education Institutions: a literature review and prospects for future research. Clean Technol Envir Policy 2021;23:2523-42.
25. Chen J, Shen L, Song X, Shi Q, Li S. An empirical study on the CO2 emissions in the Chinese construction industry. J Clean Prod 2017;168:645-54.
26. Sovacool BK, Brown MA. Twelve metropolitan carbon footprints: a preliminary comparative global assessment. Energ Policy 2010;38:4856-69.
27. Druckman A, Jackson T. The carbon footprint of UK households 1990-2004: a socio-economically disaggregated, quasi-multi-regional input-output model. Ecol Econ 2009;68:2066-77.
28. SEI. UK schools carbon footprint scoping study. Available from: https://www.sd-commission.org.uk/publications.php@id=389.html [Last accessed on 15 Dec 2023].
29. Donthu N, Kumar S, Mukherjee D, Pandey N, Lim WM. How to conduct a bibliometric analysis: an overview and guidelines. J Bus Res 2021;133:285-96.
31. Raza MS, Khahro SH, Memon SA, Ali TH, Memon NA. Global trends in research on carbon footprint of buildings during 1971-2021: a bibliometric investigation. Environ Sci Pollut Res Int 2021;28:63227-36.
32. Geng Y, Chen W, Liu Z, et al. A bibliometric review: energy consumption and greenhouse gas emissions in the residential sector. J Clean Prod 2017;159:301-16.
33. Shi S, Yin J. Global research on carbon footprint: a scientometric review. Environ Impact Asses 2021;89:106571.
35. Scopus. How are CiteScore metrics used in Scopus? Available from: https://service.elsevier.com/app/answers/detail/a_id/14880/supporthub/scopus/ [Last accessed on 15 Dec 2023].
36. Hu G, Wang L, Ni R, Liu W. Which h-index? An exploration within the Web of Science. Scientometrics 2020;123:1225-33.
37. Chen W, Geng Y, Zhong S, Zhuang M, Pan H. A bibliometric analysis of ecosystem services evaluation from 1997 to 2016. Environ Sci Pollut Res Int 2020;27:23503-13.
38. Chen W, Liu W, Geng Y, Brown MT, Gao C, Wu R. Recent progress on emergy research: a bibliometric analysis. Renew Sust Energ Rev 2017;73:1051-60.
39. Birkle C, Pendlebury DA, Schnell J, Adams J. Web of science as a data source for research on scientific and scholarly activity. Quant Sci Stud 2020;1:363-76.
40. Wiedmann T, Wood R, Minx JC, Lenzen M, Guan D, Harris R. A carbon footprint time series of the UK–results from a multi-region input-output model. Econ Syst Res 2010;22:19-42.
41. Xu L, Chen G, Wiedmann T, Wang Y, Geschke A, Shi L. Supply-side carbon accounting and mitigation analysis for Beijing-Tianjin-Hebei urban agglomeration in China. J Environ Manage 2019;248:109243.
42. Wiedmann T, Chen G, Owen A, et al. Three-scope carbon emission inventories of global cities. J Ind Ecol 2021;25:735-50.
43. Wood R, Stadler K, Simas M, et al. Growth in environmental footprints and environmental impacts embodied in trade: resource efficiency indicators from EXIOBASE3. J Ind Ecol 2018;22:553-64.
44. Iribarren D, Vázquez-Rowe I, Hospido A, Moreira MT, Feijoo G. Estimation of the carbon footprint of the Galician fishing activity (NW Spain). Sci Total Environ 2010;408:5284-94.
45. Vázquez-rowe I, Villanueva-rey P, Mallo J, De la Cerda JJ, Moreira MT, Feijoo G. Carbon footprint of a multi-ingredient seafood product from a business-to-business perspective. J Clean Prod 2013;44:200-10.
46. Connolly M, Shan Y, Bruckner B, Li R, Hubacek K. Urban and rural carbon footprints in developing countries. Environ Res Lett 2022;17:084005.
47. Clarke C, Williams ID, Turner DA. Evaluating the carbon footprint of WEEE management in the UK. Resour Conserv Recy 2019;141:465-73.
48. Galli A, Wiedmann T, Ercin E, Knoblauch D, Ewing B, Giljum S. Integrating ecological, carbon and water footprint into a “footprint family” of indicators: definition and role in tracking human pressure on the planet. Ecol Indic 2012;16:100-12.
49. Cordella M, Alfieri F, Sanfelix J. Reducing the carbon footprint of ICT products through material efficiency strategies: a life cycle analysis of smartphones. J Ind Ecol 2021;25:448-64.
50. Radonjič G, Tompa S. Carbon footprint calculation in telecommunications companies -the importance and relevance of scope 3 greenhouse gases emissions. Renew Sust Energ Rev 2018;98:361-75.
51. Vida E, Tedesco DEA. The carbon footprint of integrated milk production and renewable energy systems-a case study. Sci Total Environ 2017;609:1286-94.
52. Fang K, Dong L, Ren J, Zhang Q, Han L, Fu H. Carbon footprints of urban transition: Tracking circular economy promotions in Guiyang, China. Ecol Model 2017;365:30-44.
53. de Melo FM, Silvestre A, Carvalho M. Carbon footprints associated with electricity generation from biomass syngas and diesel. Available from: http://www.eemj.icpm.tuiasi.ro/pdfs/vol18/full/no7/1_207_de%20Melo_17.pdf [Last accessed on 15 Dec 2023].
54. Liu W, Zhang G, Wang X, Lu F, Ouyang Z. Carbon footprint of main crop production in China: magnitude, spatial-temporal pattern and attribution. Sci Total Environ 2018;645:1296-308.
55. Gutiérrez-Peña R, Mena Y, Batalla I, Mancilla-Leytón JM. Carbon footprint of dairy goat production systems: A comparison of three contrasting grazing levels in the Sierra de Grazalema Natural Park (Southern Spain). J Environ Manage 2019;232:993-8.
56. Goldhammer B, Busse C, Busch T. Estimating corporate carbon footprints with externally available data. J Ind Ecol 2017;21:1165-79.
58. Peters GP. Carbon footprints and embodied carbon at multiple scales. Curr Opin Env Sust 2010;2:245-50.
59. Mi Z, Zheng J, Meng J, et al. Economic development and converging household carbon footprints in China. Nat Sustain 2020;3:529-37.
60. Wiedmann T. A review of recent multi-region input–output models used for consumption-based emission and resource accounting. Ecol Econ 2009;69:211-22.
61. Saukko T. Factors Affecting Customer Profitability: a bibliometric study. Available from: https://urn.fi/URN:NBN:fi-fe2014072332543 [Last accessed on 15 Dec 2023].
62. Pilkington A, Meredith J. The evolution of the intellectual structure of operations management-1980-2006: A citation/co-citation analysis. J of Ops Management 2009;27:185-202.
63. Liao Y, Koelewijn SF, Van den Bossche G, et al. A sustainable wood biorefinery for low-carbon footprint chemicals production. Science 2020;367:1385-90.
64. Lenzen M, Sun Y, Faturay F, Ting Y, Geschke A, Malik A. The carbon footprint of global tourism. Nature Clim Change 2018;8:522-8.
65. Zheng J, Suh S. Strategies to reduce the global carbon footprint of plastics. Nat Clim Chang 2019;9:374-8.
66. Benjaafar S, Li Y, Daskin M. Carbon footprint and the management of supply chains: insights from simple models. IEEE Trans Autom Sci Engin 2013;10:99-116.
67. Tennison I, Roschnik S, Ashby B, et al. Health care's response to climate change: a carbon footprint assessment of the NHS in England. Lancet Planet Health 2021;5:e84-92.
68. Bello MO, Solarin SA, Yen YY. The impact of electricity consumption on CO2 emission, carbon footprint, water footprint and ecological footprint: The role of hydropower in an emerging economy. J Environ Manage 2018;219:218-30.
69. Wiedenhofer D, Guan D, Liu Z, Meng J, Zhang N, Wei Y. Unequal household carbon footprints in China. Nature Clim Change 2017;7:75-80.
70. Hua G, Cheng T, Wang S. Managing carbon footprints in inventory management. Int J Prod Econ 2011;132:178-85.
71. Malik A, Lenzen M, McAlister S, McGain F. The carbon footprint of Australian health care. Lancet Planet Health 2018;2:e27-35.
72. Pichler P, Jaccard IS, Weisz U, Weisz H. International comparison of health care carbon footprints. Environ Res Lett 2019;14:064004.
73. Minx J, Wiedmann T, Wood R, et al. Input-output analysis and carbon footprinting: an overview of applications. Econ Syst Res 2009;21:187-216.
75. Cheng K, Pan G, Smith P, et al. Carbon footprint of China's crop production-an estimation using agro-statistics data over 1993-2007. Agr Ecosyst Environ 2011;142:231-7.
76. Hillier J, Hawes C, Squire G, Hilton A, Wale S, Smith P. The carbon footprints of food crop production. Int J Agr Sustain 2009;7:107-18.
77. Yan M, Cheng K, Luo T, Yan Y, Pan G, Rees RM. Carbon footprint of grain crop production in China-based on farm survey data. J Clean Prod 2015;104:130-8.
78. Gan Y, Liang C, Chai Q, Lemke RL, Campbell CA, Zentner RP. Improving farming practices reduces the carbon footprint of spring wheat production. Nat Commun 2014;5:5012.
79. Minx J, Baiocchi G, Wiedmann T, et al. Carbon footprints of cities and other human settlements in the UK. Environ Res Lett 2013;8:035039.
80. Baiocchi G, Minx J, Hubacek K. The impact of social factors and consumer behavior on carbon dioxide emissions in the united kingdom: a regression based on input-output and geodemographic consumer segmentation data. J of Industrial Ecology 2010;14:50-72.
81. Jones C, Kammen DM. Spatial distribution of U.S. household carbon footprints reveals suburbanization undermines greenhouse gas benefits of urban population density. Environ Sci Technol 2014;48:895-902.
82. Ivanova D, Stadler K, Steen-olsen K, et al. Environmental impact assessment of household consumption. J of Industrial Ecology 2016;20:526-36.
83. Larsen HN, Pettersen J, Solli C, Hertwich EG. Investigating the carbon footprint of a university - the case of NTNU. J Clean Prod 2013;48:39-47.
84. Ozawa-meida L, Brockway P, Letten K, Davies J, Fleming P. Measuring carbon performance in a UK University through a consumption-based carbon footprint: De Montfort University case study. J Clean Prod 2013;56:185-98.
85. Alvarez S, Blanquer M, Rubio A. Carbon footprint using the compound method based on financial accounts. the case of the school of forestry engineering, technical university of Madrid. J Clean Prod 2014;66:224-32.
86. Thurston M, Eckelman MJ. Assessing greenhouse gas emissions from university purchases. Int J Sustain High Educ 2011;12:225-35.
87. Robinson OJ, Tewkesbury A, Kemp S, Williams ID. Towards a universal carbon footprint standard: a case study of carbon management at universities. J Clean Prod 2018;172:4435-55.
88. Finkbeiner M. Carbon footprinting-opportunities and threats. Int J Life Cycle Assess 2009;14:91-4.
89. Weidema BP, Thrane M, Christensen P, Schmidt J, Løkke S. Carbon footprint: a catalyst for life cycle assessment? J of Industrial Ecology 2008;12:3-6.
90. ISO. ISO 14041: environmental management-life cycle assessment-goal and scope definition and inventory analysis. Available from: https://link.springer.com/article/10.1007/BF02979337 [Last accessed on 15 Dec 2023].
91. ISO. ISO 14042 environmental management-life cycle assessment-life cycle impact assessment. Available from: https://link.springer.com/article/10.1007/BF02978514 [Last accessed on 15 Dec 2023].
92. ISO. ISO 14043: environmental management-life cycle assessment-life cycle interpretation. Available from: https://link.springer.com/article/10.1007/BF02979166 [Last accessed on 15 Dec 2023].
93. ISO. ISO 14040:2006-environmental management-life cycle assessment-principles and framework. Available from: https://www.iso.org/standard/37456.html [Last accessed on 15 Dec 2023].
94. Huang Y, Bird R, Bell M. A comparative study of the emissions by road maintenance works and the disrupted traffic using life cycle assessment and micro-simulation. Transportation Research Part D: Transport and Environment 2009;14:197-204.
95. Friedrich E, Pillay S, Buckley C. Carbon footprint analysis for increasing water supply and sanitation in South Africa: a case study. J Clean Prod 2009;17:1-12.
96. Gilliam AD, Davidson B, Guest J. The carbon footprint of laparoscopic surgery: should we offset? Surg Endosc 2008;22:573.
97. Lim SR, Park JM. Cooperative water network system to reduce carbon footprint. Environ Sci Technol 2008;42:6230-6.
98. Li X, Zheng Y. Using LCA to research carbon footprint for precast concrete piles during the building construction stage: a China study. J Clean Prod 2020;245:118754.
99. Clabeaux R, Carbajales-dale M, Ladner D, Walker T. Assessing the carbon footprint of a university campus using a life cycle assessment approach. J Clean Prod 2020;273:122600.
100. Babarenda Gamage G, Boyle C, Mclaren SJ, Mclaren J. Life cycle assessment of commercial furniture: a case study of formway LIFE chair. Int J Life Cycle Assess 2008;13:401-11.
101. Chen Q, Lai X, Gu H, et al. Investigating carbon footprint and carbon reduction potential using a cradle-to-cradle LCA approach on lithium-ion batteries for electric vehicles in China. J Clean Prod 2022;369:133342.
102. Lenzen M. Errors in conventional and input-output-based life-cycle inventories. J of Industrial Ecology 2000;4:127-48.
103. Han J, Tan Z, Chen M, Zhao L, Yang L, Chen S. Carbon footprint research based on input-output model-a global scientometric visualization analysis. Int J Environ Res Public Health 2022;19:11343.
104. Leontief WW. Quantitative Input and Output Relations in the Economic Systems of the United States. The Review of Economics and Statistics 1936;18:105.
105. Leontief W. Air pollution and the economic structure: empirical results of input-output computations. In Leontief, Wassily, Input-Output Economics, Oxford University Press: Oxford, UK; 1972. p. 9-30.
106. Duchin F. Industrial input-output analysis: implications for industrial ecology. Proc Natl Acad Sci U S A 1992;89:851-5.
107. Charoenkit S, Yiemwattana S. Living walls and their contribution to improved thermal comfort and carbon emission reduction: a review. Building and Environment 2016;105:82-94.
108. Munksgaard J, Wier M, Lenzen M, Dey C. Using Input-output analysis to measure the environmental pressure of consumption at different spatial levels. J of Industrial Ecology 2005;9:169-85.
109. JacksonT‚ Papathanasopoulou E‚ Bradley P‚ Druckman A. Attributing UK Carbon Emissions to Functional Household Needs: Methodology and Pilot Results. Available from: https://resolve.sustainablelifestyles.ac.uk/sites/default/files/RESOLVE_WP_01-07.pdf [Last accessed on 15 Dec 2023].
110. Herrmann I, Hauschild M. Effects of globalisation on carbon footprints of products. CIRP Annals 2009;58:13-6.
111. Zhong S, Chen R, Song F, Xu Y. Knowledge mapping of carbon footprint research in a LCA perspective: a visual analysis using citespace. Processes 2019;7:818.
113. Mohamed Abdul Ghani NMA, Egilmez G, Kucukvar M, S. Bhutta MK. From green buildings to green supply chains: an integrated input-output life cycle assessment and optimization framework for carbon footprint reduction policy making. MEQ 2017;28:532-48.
114. IPCC. National Greenhouse gas inventories: Land use, land use change and forestry. Available from: https://www.ipcc-nggip.iges.or.jp/public/gl/guidelin/ch5ref1.pdf [Last accessed on 15 Dec 2023].
115. IPCC. Climate change 2007: Synthesis report: Contribution of working groups I, II and III to the fourth assessment report. Available from: https://www.cma.gov.cn/en/Special/2013Special/20131023/2013102304/201310/P020131024576851575116.pdf [Last accessed on 15 Dec 2023].
Cite This Article
Export citation file: BibTeX | RIS
OAE Style
Dong Q, Zhong C, Geng Y, Dong F, Chen W, Zhang Y. A bibliometric review of carbon footprint research. Carbon Footprints 2024;3:3. http://dx.doi.org/10.20517/cf.2023.45
AMA Style
Dong Q, Zhong C, Geng Y, Dong F, Chen W, Zhang Y. A bibliometric review of carbon footprint research. Carbon Footprints. 2024; 3(1): 3. http://dx.doi.org/10.20517/cf.2023.45
Chicago/Turabian Style
Dong, Qiuxia, Chen Zhong, Yong Geng, Fanli Dong, Wei Chen, Ye Zhang. 2024. "A bibliometric review of carbon footprint research" Carbon Footprints. 3, no.1: 3. http://dx.doi.org/10.20517/cf.2023.45
ACS Style
Dong, Q.; Zhong C.; Geng Y.; Dong F.; Chen W.; Zhang Y. A bibliometric review of carbon footprint research. Carbon. Footprints. 2024, 3, 3. http://dx.doi.org/10.20517/cf.2023.45
About This Article
Copyright

Data & Comments
Data


 Cite This Article 2 clicks

 Like This Article 15
likes
Like This Article 15
likes


Comments
Comments must be written in English. Spam, offensive content, impersonation, and private information will not be permitted. If any comment is reported and identified as inappropriate content by OAE staff, the comment will be removed without notice. If you have any queries or need any help, please contact us at support@oaepublish.com.